

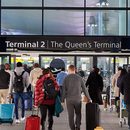
Image generated with Ai
In August 2026, US’s aviation system is pushing the limits of America’s travel. Even with all of this going on, millions of people are still moving through airports every day and strong demand is increasingly meeting up against the inundation of flights in the summer months, the runway work, the weather, and the air traffic control restrictions and infrastructure that isn’t always able to grow as fast as the airlines.
TSA processed 31,112,796 checkpoint screenings between 1 and 12 August 2026, or an average of 2,592,733 travellers a day. Meanwhile, airline performance statistics provided by the US Department of Transportation in August reveal that only 73.1% of all reported airline marketing-carrier flights were on time in June, down from 77.8% in May.
Advertisement
The message to travellers is simple: There is still a huge amount of demand for air travel in the US, but the total number of flights is as important as airport capacity and flight reliability.
TSA figures show that August started with sustained heavy traffic rather than one isolated peak.
Advertisement
Advertisement
Some of the busiest days included:
These numbers measure security-checkpoint traffic, not airport delays. However, they show the scale of demand that terminals, security lanes, baggage systems, boarding gates and ground-transport networks must absorb.
| Indicator | August 2026 figure | Why it matters |
|---|---|---|
| TSA screenings, 1–12 Aug | 31.1 million | Shows sustained summer demand |
| Daily average | 2.59 million | Keeps airport systems under continuous pressure |
| Highest day listed | 2.88 million | Illustrates peak-day intensity |
| Main pressure points | Gates, baggage, security, ATC | Capacity depends on the whole airport system |
High passenger demand does not automatically create disruption. The real risk begins when heavy traffic leaves airports with little spare capacity to recover from thunderstorms, runway closures or air traffic restrictions.
The latest Department of Transportation benchmark adds another layer to the picture.
Advertisement
Advertisement
Its August 2026 Air Travel Consumer Report covers June operations and shows that 73.1% of reported marketing-carrier flights arrived on time, down from 77.8% in May.
That is a fall of 4.7 percentage points in one month.
Among reporting airline networks:
The distinction matters: these are the latest federal reliability figures available in August, not August flight-performance data.
Cancellation figures also deserve attention. Reporting operating carriers scheduled 3,488,373 flights during the first six months of 2026 and cancelled 76,082, producing a cancellation rate of 2.18%. The comparable rate in the first half of 2025 was 1.50%.
That means cancellation pressure increased considerably even though the overall schedule did not grow at the same pace.
Chicago O’Hare offers one of the strongest examples of the gap between airline schedules and practical airport capacity.
Airlines proposed more than 3,080 flights on peak summer days, around 14.9% above the previous summer’s peak schedule.
The FAA instead limited scheduled operations to 2,708 flights per day.
That creates a difference of at least 372 flights between planned peak schedules and the permitted daily level.
Why?
The FAA identified factors including:
The O’Hare case carries a wider lesson for US aviation. Airlines can add aircraft and seats quickly. Airports cannot always add gates, taxiways, runways or airspace capacity at the same speed.
Expert insight: Useful airport capacity is not the maximum number of flights an airline can place in a timetable. It is the number the aviation system can handle safely and reliably when conditions deteriorate.
Weather remains one of the biggest variables in US summer flight reliability.
On 13 August, the FAA identified potential thunderstorm impacts around:
Wind conditions also posed possible operational challenges around JFK, LaGuardia and Newark, while low cloud could affect Seattle and San Francisco.
These were operational forecasts, not confirmation that every airport experienced disruption.
Still, the geographic spread matters.
Atlanta, Charlotte and Denver operate as major connecting hubs. A disruption at one can affect aircraft, crews and passengers scheduled to travel through completely different cities later in the day.
| Disruption | Immediate effect | Wider traveller impact |
|---|---|---|
| Thunderstorms | Fewer departures and arrivals | Missed connections |
| Strong winds | Runway changes | Reduced hourly capacity |
| Low visibility | Slower aircraft movements | Longer queues |
| Ground stop | Departures held | Delays spread to other airports |
| Construction | Fewer usable runways/taxiways | Slower recovery after disruption |
This network effect explains why a traveller can face a delay even when the weather at their departure airport looks clear.
Physical airport expansion is only part of the capacity equation.
At Newark Liberty International Airport, the FAA introduced a new Surface Movement Radar Model 4 in August. The system replaces equipment that had operated for roughly 30 years.
The radar helps controllers monitor aircraft and vehicles moving across runways and taxiways under different visibility conditions.
Newark handles well over 1,000 flights a day, making reliable surface surveillance especially important.
Planned improvements also include:
These projects reveal a less visible side of the US airport capacity challenge. Reliable aviation increasingly depends on resilient digital communications and air traffic technology as much as terminal space.
The capacity issue is no longer confined to New York, Chicago, Atlanta or Los Angeles.
Asheville Regional Airport opened a new 121-foot air traffic control tower in August after air-carrier operations increased by more than 300% over the previous decade.
Federal investment includes:
Moving from five gates to 12 represents a 140% increase in gate capacity.
Asheville highlights an important trend: rapid tourism and population growth can place regional airports under the same infrastructure pressure once associated mainly with major US hubs.
The federal response extends well beyond individual airports.
In August, the FAA announced $870 million through 339 airport infrastructure grants covering 44 states and two territories.
Major projects include:Project Federal funding Los Angeles International terminal access road $289 million Miami International terminal work $50 million Akron-Canton facilities and passenger bridges $9.1 million Charleston International terminal expansion $3.7 million Sugar Land Regional runway reconstruction $3.5 million
The funding covers more than runways. It can support terminals, taxiways, baggage systems, airport roads, planning and safety improvements.
That broad investment shows why the phrase airport capacity should not be reduced to aircraft movements alone. A flight can only operate smoothly when every part of the passenger and aircraft journey works together.
Federal data also provide a practical takeaway for passengers.
At America’s 30 largest airports, DOT’s latest figures show that 87.2% of flights scheduled to arrive between 6:00 and 6:59 a.m. were on time, rising to 88.5% between 7:00 and 7:59 a.m.
Later in the day, performance weakened substantially.
For departures, 90.6% of flights scheduled around 6 a.m. operated on time, compared with just 55.7% around 7 p.m.
Morning flights are not immune to disruption. However, the data suggest they often benefit from fewer accumulated delays from earlier aircraft movements and weather events.
Travellers can reduce risk by:
US summer travel in August 2026 is not simply a story of crowded airports. It is a test of how effectively the world’s largest aviation market can turn massive passenger demand into dependable journeys.
TSA figures confirm intense travel volumes. DOT data show weaker recent on-time performance. Chicago O’Hare demonstrates how airline schedules can exceed practical operating limits. Newark highlights the need for modern air traffic technology, while Asheville shows that capacity pressure is spreading into fast-growing regional markets.
The decisive issue is therefore resilience.
America can keep adding flights and passengers, but long-term growth will depend on whether terminals, gates, runways, air traffic systems and airport infrastructure can absorb disruption without allowing delays to cascade across the network.
For travellers, that makes US airport capacity and flight reliability two of the defining issues of summer 2026.
In conclusion, US summer travel faces airport capacity crunch as flight reliability comes under pressure: With high passenger loads being met against shrinking airport facilities, weather disruptions, runway work and air traffic restrictions all colliding, high demand is meeting low capacity. More people are travelling on major hubs and when things go wrong, less can be done when they are at their limits. The FAA is investing in terminals, control towers, radar and airport infrastructure, reflecting its concern about capacity. For travellers, the answer is obvious: US travel is holding up well in summer, but when it comes to reliable travel, it is becoming more and more important whether airports can increase capacity and improve operational resiliency quickly enough.
Advertisement
Advertisement
Advertisement













Saturday, September 5, 2026
Friday, September 4, 2026

Saturday, September 5, 2026

Saturday, September 5, 2026

Thursday, September 3, 2026

Wednesday, September 2, 2026

Saturday, September 5, 2026

Saturday, September 5, 2026