

Image generated with Ai
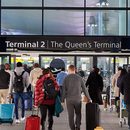
US unites with Mexico in fueling Canada tourism with a surge in tourist arrivals in Toronto throughout seven months of 2026 as strong cross-border demand drives visitor growth. The United States and Mexico generated more than 1.1 million arrivals at Toronto Pearson, supported by major events, strong connectivity and rising interest in Toronto’s leisure experiences.
Toronto entered 2026 with something most destinations want: a huge tourism market sitting just across the border. Seven months later, the value of that position is becoming increasingly clear.
The supplied Toronto Pearson data show 1,044,380 arrivals from the United States between January and July, while Mexico contributed another 67,793. Together, the two North American markets generated 1,112,173 arrivals at Pearson over the seven-month period.
For Toronto, the numbers tell a story of a winter base turning into a powerful summer wave. US monthly arrivals increased from 86,318 in January to 237,055 in July. Mexico moved from 6,758 to 14,425 over the same period.
Advertisement
This growth is landing in a city that already welcomed a record 28.2 million visitors in 2025, generating C$9.1 billion in direct spending. The United States alone supplied about 1.9 million visitors that year, showing why the American market remains critical to Toronto.
The American story began steadily. January and February each recorded 86,318 arrivals, with both months showing 5.4% year-on-year growth in the supplied data.
Then the pace changed.
March arrivals jumped 30.2% month on month to 112,377, although they remained 1.7% below the previous year. April delivered a much stronger turnaround. Arrivals climbed to 144,521, representing a 28.6% monthly increase and 16.2% year-on-year growth.
By May, Toronto was receiving 159,263 US arrivals. The annual increase slowed to 1.7%, but the direction of monthly volumes was clear. Toronto was heading towards its crucial summer season with far more American arrivals than it had seen during winter.
| Month | US Arrivals | Month-on-Month Change | Year-on-Year Change |
|---|---|---|---|
| January | 86,318 | +1.9% | +5.4% |
| February | 86,318 | +1.9% | +5.4% |
| March | 112,377 | +30.2% | -1.7% |
| April | 144,521 | +28.6% | +16.2% |
| May | 159,263 | +10.2% | +1.7% |
| June | 218,528 | +37.2% | +2.2% |
| July | 237,055 | +8.5% | +5.6% |
| Jan–Jul Total | 1,044,380 | — | — |
| Average Monthly YoY Change | — | — | +5.0% |
June provided the clearest turning point. US arrivals surged 37.2% from May to 218,528, just as Toronto stepped onto one of the biggest stages in global sport.
The city hosted 6 FIFA World Cup matches, attracting approximately 250,000 spectators to Toronto Stadium. More than 350,000 people also attended the FIFA Fan Festival across 23 event days.
The tournament turned football into a city-wide tourism product. Fans arriving for matches also spent time in Toronto’s restaurants, hotels, neighbourhoods, waterfront attractions and entertainment districts.
Preliminary city data provided another clue to the importance of the American market. Around 15% of spending by out-of-town visitors during Toronto’s six-game period came from US visitors.
The summer surge did not disappear when June ended. US arrivals climbed again to 237,055 in July, the highest monthly figure in the seven-month dataset. That was 8.5% above June and 5.6% higher year on year.
Toronto had actively prepared to turn major-event attention into wider tourism demand. Destination Toronto promoted the city’s festivals, patios, neighbourhoods, food, culture and attractions alongside the World Cup.
The potential reward extends beyond one summer. Preliminary research found that around 9 in 10 surveyed visitors were likely to return to Toronto for leisure within the next 2 years. That gives the city an opportunity to transform first-time sports visitors into repeat leisure travellers.
While the United States supplied the scale, Mexico produced some of the strongest percentage increases.
Mexican arrivals at Pearson rose from 6,758 in January to 14,425 in July. Every month in the supplied Mexican dataset recorded positive year-on-year growth.
March was particularly powerful. Arrivals surged 67.2% from February to 8,914, while year-on-year growth reached 43.6%. April followed with 11,588 arrivals.
May produced a temporary monthly decline of 18.8%, bringing arrivals down to 9,405. Yet the figure was still 23.2% higher than a year earlier. June then recovered to 11,371, before July climbed another 26.9% to 14,425.
| Month | Mexico Arrivals | Month-on-Month Change | Year-on-Year Change |
|---|---|---|---|
| January | 6,758 | -4.2% | +23.8% |
| February | 5,332 | -21.1% | +17.3% |
| March | 8,914 | +67.2% | +43.6% |
| April | 11,588 | +30.0% | +3.2% |
| May | 9,405 | -18.8% | +23.2% |
| June | 11,371 | +20.9% | +11.4% |
| July | 14,425 | +26.9% | +13.2% |
| Jan–Jul Total | 67,793 | — | — |
| Average Monthly YoY Change | — | — | +19.4% |
The strength of US arrivals into Toronto becomes even more interesting when placed against the wider cross-border travel environment.
Statistics Canada has reported weakness in Canadian travel to the United States, while transborder aviation indicators have also shown periods of softer traffic. This means cross-border tourism is not necessarily moving equally in both directions.
That distinction is crucial. A decline in Canadians travelling south does not automatically mean Americans are abandoning Canada. Toronto Pearson’s US arrival figures instead show strong inbound volumes building towards summer, with the average of the seven reported monthly year-on-year rates standing at approximately 5.0%.
Mexico performed even more strongly on this measure, with its seven monthly year-on-year rates averaging approximately 19.4%.
The journey was not completely smooth. US arrivals were 1.7% lower year on year in March. Mexican arrivals fell month on month by 4.2% in January, 21.1% in February and 18.8% in May.
Those fluctuations matter because tourism rarely grows in a perfect straight line. Holiday calendars, airline capacity, fares, school breaks, major events and seasonal demand can all reshape monthly traffic.
What stands out is the recovery after those weaker points. By July, US and Mexican arrivals together had reached 1,112,173 across the seven-month period.
Toronto is therefore building its North American tourism story from two very different engines. The United States provides enormous cross-border scale, while Mexico is delivering faster percentage growth. Add the World Cup, Toronto’s international profile and strong air connectivity, and the city has a powerful opportunity to turn the summer surge into repeat demand well beyond 2026.
US unites with Mexico in fueling Canada tourism with a surge in tourist arrivals in Toronto throughout seven months of 2026 as strong cross-border demand, major events and improved connectivity drive visitor growth, with both markets strengthening Toronto’s inbound travel momentum.
In conclusion, the US unites with Mexico in fueling Canada tourism with a surge in tourist arrivals in Toronto throughout seven months of 2026 as strong cross-border demand, major events and improved connectivity accelerate visitor growth. The United States continues to provide significant travel volume, while Mexico delivers rapid expansion, together creating a powerful tourism engine for Toronto. With more than 1.1 million combined arrivals recorded at Toronto Pearson, the city is strengthening its position as a leading destination by converting short-term travel momentum into long-term leisure demand, repeat visits and broader international tourism opportunities.
Advertisement
Advertisement
Advertisement













Saturday, September 5, 2026
Friday, September 4, 2026

Saturday, September 5, 2026

Friday, September 4, 2026

Thursday, September 3, 2026

Wednesday, September 2, 2026

Friday, September 4, 2026