
Brazil Joins Colombia and More as South America Remains the Only Region Propelling US Tourism with Growth in Tourist Arrivals in 2026

Updated
Published
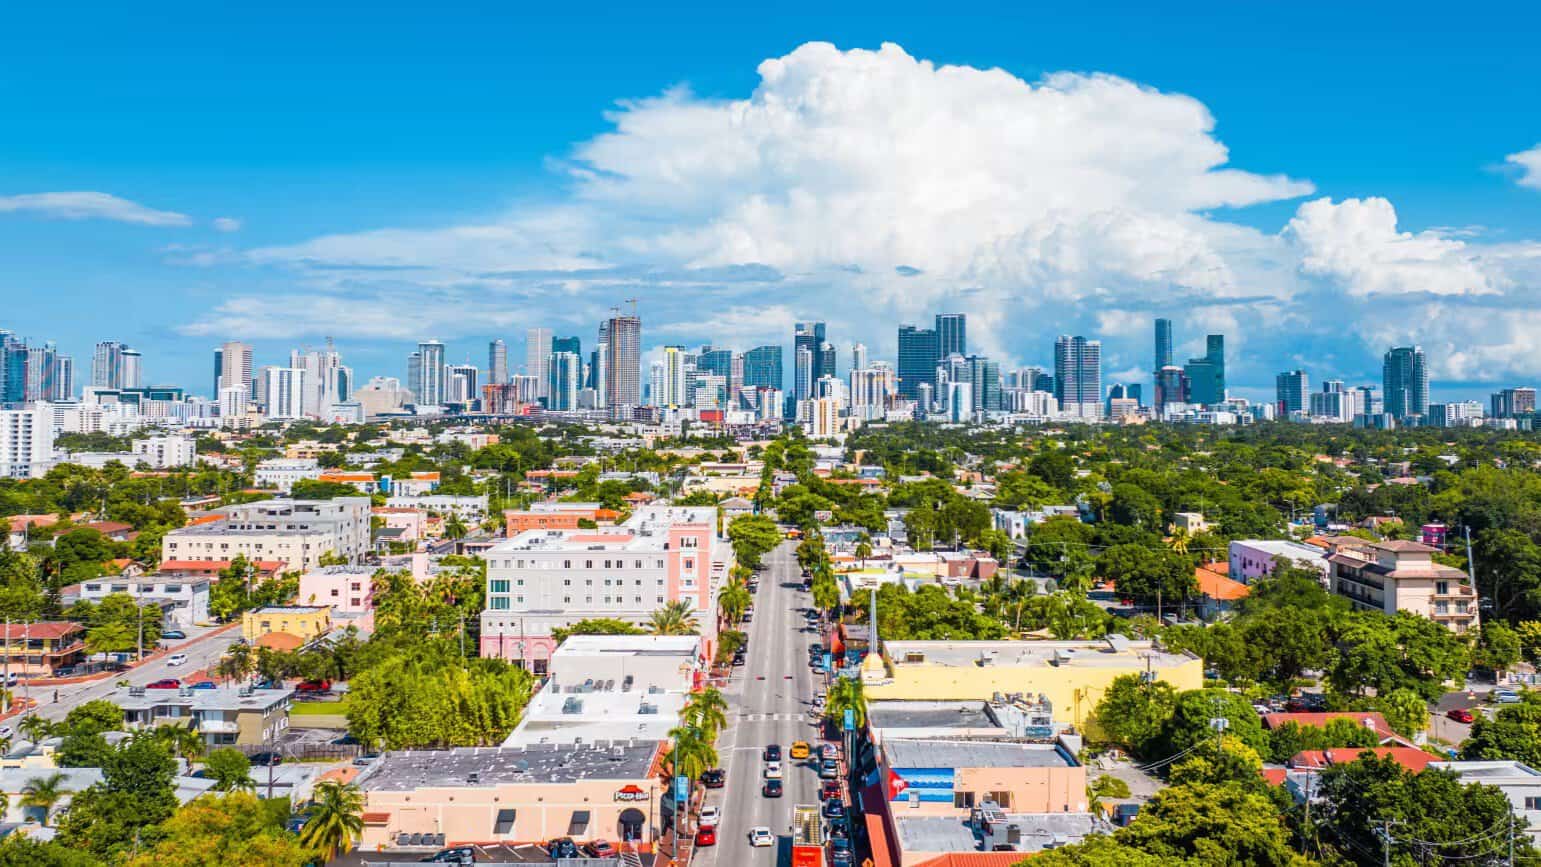
Brazil joins Colombia and more markets as South America remains the only region propelling US tourism with growth in tourist arrivals in 2026, driven by 2.73 million visitors and strong gains from Colombia, Ecuador and other expanding markets.
South America emerged as the only region in the supplied US inbound tourism data to record overall growth in the first half of 2026, generating 2,728,255 arrivals between January and June, up 5.5% from 2,586,227 during the same period in 2025. Brazil remained the region’s largest source market with 960,046 arrivals, while Colombia and Ecuador delivered some of the strongest increases among the higher-volume markets.
The regional increase translated into 142,028 additional arrivals from South America compared with January–June 2025. However, growth was not universal across the continent, with Chile, Venezuela, Guyana and Suriname recording declines.
South America Generates More Than 2.7 Million US Arrivals
South American markets collectively generated 2,728,255 arrivals to the United States during January–June 2026, compared with 2,586,227 during the corresponding six months of 2025.
Advertisement
Advertisement
That represents growth of 5.5%, equivalent to an additional 142,028 arrivals.
The regional performance was driven by a combination of high-volume markets such as Brazil and rapidly expanding markets including Colombia, Ecuador and Paraguay.
Advertisement
Advertisement
South American Tourist Arrivals to the US
| Period | Tourist Arrivals | Numerical Change | YoY Change |
|---|---|---|---|
| Jan–Jun 2025 | 2,586,227 | — | — |
| Jan–Jun 2026 | 2,728,255 | +142,028 | +5.5% |
The figures underline the significance of South America to US inbound tourism during the first half of 2026. The regional increase was achieved despite declines from several individual countries.
Brazil Remains South America’s Largest US Tourism Market
Brazil generated 960,046 arrivals to the United States during January–June 2026, compared with 952,108 during the same period in 2025.
That represented modest growth of 0.8%, or an additional 7,938 arrivals.
Although Brazil’s percentage increase was considerably smaller than the growth recorded by Colombia, Ecuador and Paraguay, its much larger visitor base meant it remained the leading South American source market in the supplied data.
Colombia ranked second by volume with 566,162 arrivals, followed by Argentina with 421,466, Ecuador with 251,989 and Peru with 181,829.
Colombia Adds Nearly 84,000 Arrivals
Colombia delivered one of the most significant increases in absolute visitor numbers.
Advertisement
Advertisement
US arrivals from Colombia climbed from 482,229 in January–June 2025 to 566,162 in January–June 2026.
That represented 17.4% growth and an increase of 83,933 visitors.
Colombia alone accounted for a substantial portion of South America’s overall numerical increase during the period.
The combination of high visitor volume and double-digit growth distinguished Colombia from Brazil, which remained substantially larger but grew by only 0.8%.
Ecuador Records 26.5% Increase
Ecuador was another major contributor to South America’s positive performance.
Arrivals increased from 199,207 during January–June 2025 to 251,989 in the same period of 2026.
Advertisement
Advertisement
The increase of 52,782 arrivals represented year-on-year growth of 26.5%.
Among the higher-volume South American markets in the supplied data, Ecuador therefore recorded one of the strongest rates of expansion.
Peru also remained in positive territory. Arrivals increased from 170,075 to 181,829, representing growth of 6.9% and an additional 11,754 visitors.
Paraguay Records Fastest Percentage Growth
Paraguay recorded the strongest percentage increase among the South American markets in the supplied dataset.
Arrivals climbed from 14,437 during January–June 2025 to 19,638 during January–June 2026, an increase of 36%.
That translated into 5,201 additional arrivals.
Advertisement
Advertisement
Although Paraguay’s absolute visitor volume remained considerably smaller than Brazil, Colombia, Argentina, Ecuador and Peru, its growth rate placed it at the top of the regional ranking by percentage increase.
South American Markets Recording Growth in US Tourist Arrivals
| Country | Jan–Jun 2025 | Jan–Jun 2026 | YoY Growth | Additional Arrivals |
|---|---|---|---|---|
| Brazil | 952,108 | 960,046 | +0.8% | +7,938 |
| Colombia | 482,229 | 566,162 | +17.4% | +83,933 |
| Argentina | 413,615 | 421,466 | +1.9% | +7,851 |
| Ecuador | 199,207 | 251,989 | +26.5% | +52,782 |
| Peru | 170,075 | 181,829 | +6.9% | +11,754 |
| Uruguay | 35,304 | 38,338 | +8.6% | +3,034 |
| Bolivia | 30,442 | 31,528 | +3.6% | +1,086 |
| Paraguay | 14,437 | 19,638 | +36.0% | +5,201 |
| French Guiana | 536 | 616 | +14.9% | +80 |
| Falkland Islands | 81 | 88 | +8.6% | +7 |
Colombia and Ecuador Drive Much of the Numerical Increase
Percentage growth alone does not reveal which markets contributed the most additional travellers.
Colombia added 83,933 arrivals, while Ecuador contributed another 52,782. Together, these two markets generated 136,715 additional arrivals compared with the corresponding January–June period of 2025.
Peru added 11,754 visitors, while Argentina contributed another 7,851 and Brazil added 7,938.
This demonstrates the difference between market size and growth momentum. Brazil remained the largest source market but contributed a relatively modest numerical increase, while Colombia and Ecuador combined substantial visitor volumes with much stronger percentage growth.
Not Every South American Market Recorded Growth
South America’s overall 5.5% increase did not mean that every market expanded.
Advertisement
Advertisement
Chile generated 158,163 arrivals during January–June 2026, down 11.1% from 177,843 in the corresponding period of 2025.
Venezuela declined 12%, from 75,494 to 66,418.
Guyana recorded 25,872 arrivals, down 8.9% from 28,386, while Suriname declined 5.7%, from 6,470 to 6,102.
South American Markets Recording Declines
| Country | Jan–Jun 2025 | Jan–Jun 2026 | YoY Change | Numerical Change |
|---|---|---|---|---|
| Chile | 177,843 | 158,163 | -11.1% | -19,680 |
| Venezuela | 75,494 | 66,418 | -12.0% | -9,076 |
| Guyana | 28,386 | 25,872 | -8.9% | -2,514 |
| Suriname | 6,470 | 6,102 | -5.7% | -368 |
Venezuela recorded the steepest percentage decline among these markets, while Chile experienced the largest numerical reduction.
Brazil Colombia Argentina Ecuador and Peru Dominate Arrivals
The regional tourism picture remained heavily concentrated among its largest markets.
Brazil, Colombia, Argentina, Ecuador and Peru together generated 2,381,492 arrivals during January–June 2026.
Advertisement
Advertisement
That represents approximately 87.3% of South America’s total 2,728,255 arrivals in the supplied dataset.
Five Largest South American Source Markets
| Rank | Country | Jan–Jun 2026 Arrivals | YoY Change |
|---|---|---|---|
| 1 | Brazil | 960,046 | +0.8% |
| 2 | Colombia | 566,162 | +17.4% |
| 3 | Argentina | 421,466 | +1.9% |
| 4 | Ecuador | 251,989 | +26.5% |
| 5 | Peru | 181,829 | +6.9% |
| Combined | 2,381,492 | — |
Brazil alone represented roughly 35.2% of total South American arrivals in the dataset, while Colombia accounted for approximately 20.8%.
January–August Projection Points to Around 3.64 Million Arrivals
If South America’s average January–June 2026 arrival pace continued through July and August, the region would reach approximately 3.64 million US arrivals during the first eight months of 2026.
Maintaining the same 5.5% year-on-year relationship would imply approximately 189,000 additional arrivals compared with the reconstructed January–August comparison level.
South America US Tourism Projection
| Period | Tourist Arrivals | YoY Change | Numerical Increase |
|---|---|---|---|
| Jan–Jun 2026 actual | 2,728,255 | +5.5% | +142,028 |
| Jan–Aug 2026 projection | ~3,637,673 | ~+5.5% | ~+189,000 |
The January–August figures are projections rather than confirmed arrival statistics. They assume that the average monthly pace and year-on-year growth recorded during the first six months continued through July and August.
South America’s Growth Story Is Concentrated in Key Markets
South America’s positive regional result masks significant differences between individual source countries.
Advertisement
Advertisement
Brazil supplied the largest number of visitors, but its 0.8% increase was modest. Colombia combined the second-largest arrival volume with strong 17.4% growth, while Ecuador expanded 26.5%.
Paraguay recorded the fastest percentage growth at 36%, although from a considerably smaller visitor base.
At the other end of the spectrum, Venezuela, Chile, Guyana and Suriname remained below their January–June 2025 levels.
The result is a regional tourism picture driven primarily by the strength of selected expanding markets rather than uniform growth across South America.
Latest Position
South America generated 2,728,255 arrivals to the United States during January–June 2026, an increase of 142,028 visitors or 5.5% compared with 2,586,227 during the corresponding period of 2025.
Brazil remained the largest source market with 960,046 arrivals, while Colombia added the greatest number of visitors among the growing individual markets, increasing by 83,933. Ecuador grew 26.5%, while Paraguay posted the fastest percentage increase at 36%.
Advertisement
Advertisement
If the first-half pace continued through August, South American arrivals could reach approximately 3.64 million, although that figure remains a projection and should not be presented as a confirmed January–August total.
Brazil joins Colombia and more as South America remains the only region propelling US tourism with growth in tourist arrivals in 2026, adding 142,028 visitors as the region reached 2.73 million arrivals through strong performances across key markets.
In conclusion, Brazil joins Colombia and more as South America remains the only region propelling US tourism with growth in tourist arrivals in 2026, supported by strong performances from major source markets and rising visitor demand across the continent. South America generated 2,728,255 arrivals to the United States during the first half of 2026, recording a 5.5% increase compared with the previous year. While Brazil remained the largest contributor by visitor volume, Colombia and Ecuador delivered significant growth momentum. The results highlight South America’s key role in strengthening US inbound tourism, even as some individual markets experienced declines during the period.
Advertisement
