
Japan Emerges Alongside South Korea and Others as Asia’s 2026 Travel Spending Trends Diverge From Arrival Growth

Updated
Published
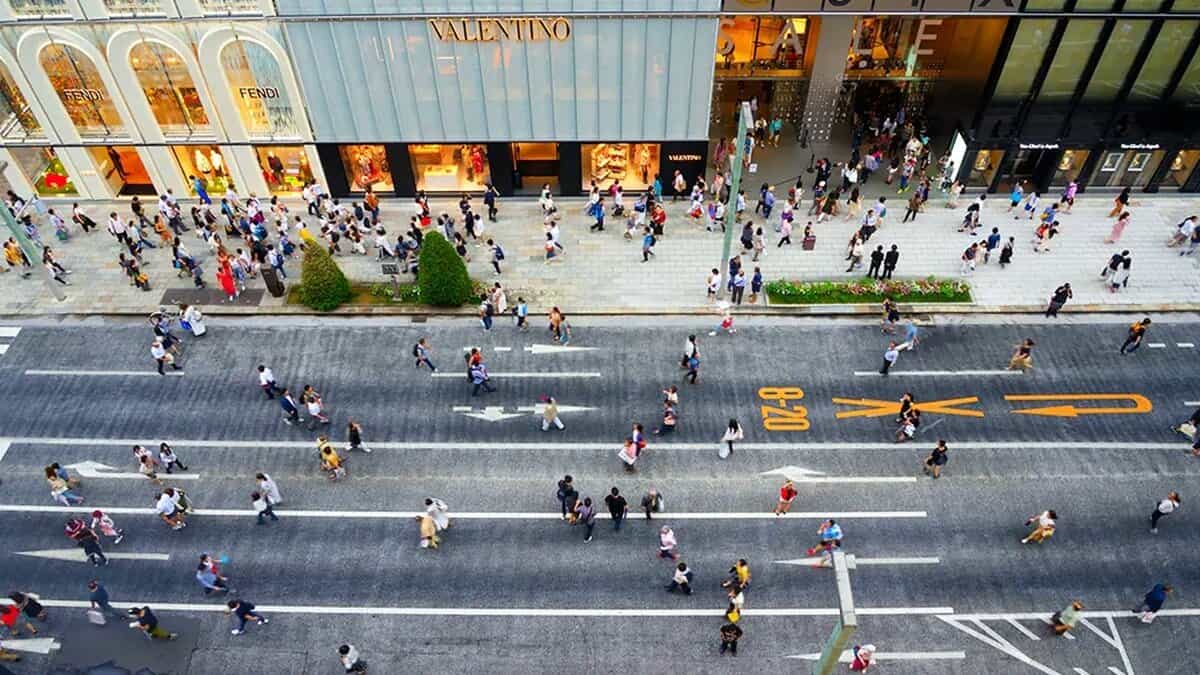
Japan, South Korea, China, Thailand and Malaysia are showing why international tourist spending is becoming as important as visitor arrivals in measuring Asian tourism growth. Japan reported a 3.4% rise in spending per general foreign visitor in the second quarter of 2026. South Korea recorded 48.5% growth in tourism-related foreign card spending against 21.6% growth in arrivals during January–August. China’s 2025 inbound expenditure grew nearly 40%, while Malaysia’s rose 16.5%. Thailand is pursuing longer stays and higher-value tourism. The five markets share a common challenge: converting travel demand into greater economic returns.
Asia Tourism in 2026 Is Entering a More Complex Growth Phase
The latest official tourism figures across five major Asian destinations reveal an important change in the international travel market. Growing visitor numbers no longer provide a complete picture of tourism success.
Japan’s recent spending figures demonstrate the importance of expenditure per visitor. South Korea provides an example of tourism-related card spending growing substantially faster than international arrivals. China’s latest annual statistics show inbound spending outpacing visitor growth, while Thailand is adjusting its tourism strategy to place greater emphasis on higher-value experiences.
Malaysia adds another important dimension. Its latest annual tourism accounts demonstrate how the economic value of an overnight visitor can differ sharply from that of a same-day visitor.
Advertisement
Advertisement
These are not identical developments, and the countries are not following one common policy. Yet they raise the same commercial question for travel agents, hotel operators, destination authorities and tourism investors.
How much economic value does each international visitor generate, and where does that expenditure go?
Advertisement
Advertisement
The answer can influence destination marketing, hotel investment, regional transport connections, tourism product development and the future balance between mass tourism and premium experiences.
Official Tourism Statistics Reveal a Clear Gap Between Visitor Growth and Spending
An examination of the latest available official releases identifies several examples of tourism expenditure increasing faster than visitor numbers.
However, publication periods differ between countries. Japan and South Korea have reported relevant 2026 spending information, while the latest fully documented annual spending comparisons used here for China and Malaysia relate to 2025.
| Country | Official visitor arrival indicator | Tourism spending indicator | Per-visitor evidence |
|---|---|---|---|
| Japan | 27.626 million arrivals, January–August 2026, down 2.7% | ¥2.5125 trillion in April–June 2026, up 0.3% | ¥245,000 per general foreign visitor in Q2, up 3.4% |
| South Korea | 15.048 million arrivals, January–August 2026, up 21.6% | KRW14.018 trillion in tourism-related foreign card spending, up 48.5% | Approximately KRW932,000 in recorded card spending per arrival, up 22.2% |
| China | Approximately 154.5 million inbound tourist visits in 2025, up 17.1% | More than US$130 billion, up nearly 40% | More than approximately US$841 per inbound visit, using rounded annual figures |
| Thailand | 20.935 million arrivals, January–August 2026, down 3.1% | Around THB679 billion in receipts from more than 14 million arrivals by 2 June | No sufficiently precise, matching national expenditure series established for this comparison |
| Malaysia | 42.197 million inbound visits in 2025, up 11.2% | RM124.842 billion, up 16.5% | Approximately RM2,959 per inbound visit, up 4.8% |
Source and methodology: Japan’s arrivals and Thailand’s January–August arrivals are cited in the South Korean Ministry of Culture, Sports and Tourism comparison, compiled from national statistical agencies. Spending data come from the Japan Tourism Agency, South Korean ministry, Chinese Ministry of Culture and Tourism, Tourism Authority of Thailand and Department of Statistics Malaysia.
Calculated values are editorial estimates, not directly published national per-visitor rankings. South Korea’s calculation reflects recorded tourism-related card transactions rather than all tourism spending. China uses rounded national totals. The five figures cannot be compared as equivalent monetary measures without further harmonisation.
Japan’s Tourism Spending Rises Even as International Arrival Growth Weakens
Japan provides one of the clearest examples of why international visitor numbers and tourist spending must be examined separately.
Advertisement
Advertisement
According to the Japan Tourism Agency’s inbound consumption survey, updated on 9 October 2026, international visitor expenditure reached ¥2.5125 trillion during April–June 2026.
This represented a modest year-on-year increase of 0.3%.
However, expenditure per general foreign visitor reached approximately ¥245,000, an increase of 3.4% compared with the same quarter in 2025.
The distinction matters. Total tourism revenue and expenditure per visitor can move at different rates because the number of visitors, their length of stay and their spending habits can change independently.
Meanwhile, the Japan National Tourism Organization reported 3,098,900 international arrivals in August 2026, a decline of 9.6% from August 2025.
Despite the overall monthly fall, 14 source markets achieved August records, including South Korea, Malaysia and the United States.
Advertisement
Advertisement
This indicates that Japan’s arrival slowdown was not uniform across its international markets. It also underlines the importance of studying individual source markets rather than treating all inbound tourism demand as one category.
Japan’s long-term policy reinforces this approach. Its Fifth Tourism Nation Promotion Basic Plan, approved on 27 March 2026, retains targets of 60 million inbound visitors and ¥15 trillion in annual international visitor spending by 2030.
The plan also prioritises regional tourism, repeat visitors, longer stays outside major cities and measures to prevent excessive tourism pressure.
For accommodation providers and destination businesses, the implication is significant. Higher revenue from longer, more diverse itineraries could support tourism economies beyond Tokyo, Osaka and Kyoto without relying solely on additional visitors to heavily frequented attractions.
South Korea’s Spending Growth Outpaces Its Record Tourism Arrivals
South Korea presents a different but equally important tourism growth pattern.
The Ministry of Culture, Sports and Tourism reported 15,048,435 international visitors between January and August 2026.
Advertisement
Advertisement
That represented a 21.6% increase from 12,379,498 arrivals during the same period in 2025.
Tourism-related spending by international visitors using cards reached KRW14.018 trillion, compared with KRW9.4396 trillion a year earlier.
The increase was 48.5%, more than twice the percentage growth in visitor arrivals.
A calculation dividing the recorded card spending by arrivals produces an indicative value of approximately KRW932,000 per arrival, compared with KRW763,000 during January–August 2025.
That represents an increase of approximately 22.2%.
It is important to distinguish this calculation from a national estimate of average tourist expenditure. Card transactions do not necessarily capture cash spending or every category of tourism purchase.
Advertisement
Advertisement
Nevertheless, the comparison provides a useful indication that tourism-related card expenditure was rising faster than inbound traffic.
South Korea is also widening access to its tourism regions. The ministry reported that 27.8% of international visitors entered through regional airports and seaports during January–August 2026.
Tourism demand from mainland China reached 4,816,134 visitors, up 29%, while arrivals from Japan increased 17.5% to 2,698,857.
Arrivals from Malaysia reached 206,838, up 12.6%, and those from Thailand increased 14.9% to 229,746.
The government has also revised certain multiple-entry visa requirements for Southeast Asian nationals and introduced a temporary visa-free group tourism pilot for eligible Indonesian visitors.
For the travel trade, South Korea’s challenge is no longer simply attracting more people. It is also to extend visitor stays, increase regional spending and convert cultural interest into accommodation, shopping, experiences and other tourism purchases.
Advertisement
Advertisement
China Seeks Higher Tourism Value Through Easier Entry and Better Visitor Services
China’s tourism recovery adds another dimension to Asia’s changing tourism economics.
Official figures presented through the Ministry of Culture and Tourism show that China received more than 150 million inbound tourist visits in 2025.
More detailed figures published by the Beijing Municipal Government put the total at approximately 154.5 million, representing 17.1% annual growth.
Inbound tourism expenditure exceeded US$130 billion, with annual spending growth approaching 40%.
Using the rounded visit total and expenditure threshold suggests receipts of more than approximately US$841 per inbound trip.
The calculation should not be treated as a precise average for foreign leisure tourists. China’s inbound tourism statistics include different categories of visitors, and the total encompasses a wider population than foreign holidaymakers alone.
Advertisement
Advertisement
Even with that limitation, the faster growth in receipts compared with visits provides evidence that inbound tourism revenue was increasing at a stronger rate than overall traffic.
China’s Tourism Power Development Plan for 2026–2030, published through an official government tourism bureau, targets 190 million annual inbound tourist visits and more than US$150 billion in yearly spending by 2030.
The plan emphasises smoother international entry, transport connectivity, accommodation services, shopping, digital payments, multilingual information and better integration between tourism and cultural activities.
Its broader direction is to make international travel easier while expanding the range of visitor experiences.
For travel companies, simplified payment procedures and improved access can reduce barriers that discourage spending after arrival.
China’s growth opportunity therefore lies in both expanding visitor demand and making the travel experience more convenient, accessible and commercially valuable.
Advertisement
Advertisement
Thailand Puts Longer Stays and Higher-Value Experiences at the Centre of Tourism Growth
Thailand is making the connection between visitor value and tourism strategy particularly explicit.
The Tourism Authority of Thailand has placed greater emphasis on expenditure, quality-led growth and visitor experiences rather than depending exclusively on rising international arrival totals.
Thailand received 9.31 million international visitors in the first quarter of 2026.
By 2 June, arrivals had exceeded 14 million, generating approximately THB679 billion in tourism revenue, according to the tourism authority’s June industry update.
The authority has identified wellness, responsible tourism, culture and more meaningful destination experiences as important parts of its growth strategy.
Long-haul travellers are a particularly relevant segment because their average stays and spending patterns can differ from those of short regional visitors.
Advertisement
Advertisement
A September update from the Tourism Authority of Thailand provides a specific example.
Thailand received 1,081,929 visitors from the United States in 2025. Those visitors stayed an average of 14.59 nights and spent more than THB69,415 per person per trip.
That figure offers a clearer illustration of high-value market development than a general national arrivals total.
A further development emerged on 7 October 2026.
The tourism authority announced a cooperation framework with aviation and tourism partners to develop destination experiences for eligible transit passengers.
The proposed programme would connect suitable passengers with attractions, shopping and local tourism businesses during sufficiently long connections.
Advertisement
Advertisement
It remains a development initiative rather than a fully implemented nationwide service.
However, its economic purpose is clear: generate additional tourism expenditure from travellers already passing through the country’s transport system.
This demonstrates that tourism value can increase through better visitor services and new experiences, not only through attracting additional arrivals.
Malaysia’s Latest Tourism Accounts Reveal Why Overnight Visitors Matter More Than Raw Arrivals
Malaysia provides one of the strongest statistical cases for examining the composition of inbound tourism.
According to the Department of Statistics Malaysia’s Tourism Satellite Account 2025, released in September 2026, international visitor arrivals rose from 37,961,485 in 2024 to 42,196,892 in 2025.
That was an increase of approximately 11.2%.
Advertisement
Advertisement
Over the same period, inbound tourism expenditure increased from RM107.145 billion to RM124.842 billion, representing growth of 16.5%.
Dividing total spending by total visits gives an estimated average of RM2,959 per arrival in 2025, compared with RM2,822 in 2024.
This means average inbound expenditure per recorded visit increased by approximately 4.8%.
However, Malaysia’s detailed statistics reveal a more important distinction.
The national figures include both overnight tourists and same-day excursionists. These groups produce very different levels of tourism expenditure.
Malaysia’s Spending Per Visitor by Travel Type
| Visitor type | 2025 arrivals | 2025 expenditure | Calculated spending per visit |
|---|---|---|---|
| Overnight tourists | 26,613,597 | RM119.312 billion | RM4,483 |
| Same-day excursionists | 15,583,295 | RM5.530 billion | RM355 |
| All inbound visitors | 42,196,892 | RM124.842 billion | RM2,959 |
Source: Department of Statistics Malaysia, Tourism Satellite Account 2025, inbound tourism indicators and expenditure tables. Per-visit figures are calculated from the original statistical tables.
Advertisement
Advertisement
Overnight tourists represented approximately 63.1% of all inbound visitors in 2025 but accounted for approximately 95.6% of inbound expenditure.
This difference is substantial.
It shows why a destination with a large number of border crossings cannot automatically be considered more commercially successful than a destination attracting fewer visitors who stay longer.
Malaysia’s transport profile makes the distinction especially relevant. Official statistics show that land transport accounted for 66.9% of inbound arrivals in 2025.
The country’s ongoing tourism development also supports international connectivity and extended travel demand.
According to Tourism Malaysia, international visitor arrivals reached 21.1 million during January–June 2026, an increase of 2.5% from the equivalent period in 2025.
Advertisement
Advertisement
The Visit Malaysia 2026–2027 campaign provides an additional framework for promoting tourism experiences, regional connectivity and visitor spending.
Five Asian Tourism Markets Are Connected by More Than Competition
The five destinations are also connected through international travel flows.
South Korea’s latest official statistics identify China, Japan, Thailand and Malaysia as established inbound source markets.
Malaysia’s 2025 statistical tables likewise record arrivals from China, Thailand, South Korea and Japan.
In 2025, Malaysia received approximately 4.66 million visitors from China, 2.50 million from Thailand, 558,503 from South Korea and 416,492 from Japan.
These figures illustrate the importance of regional tourism demand within Asia.
Advertisement
Advertisement
A change in travel affordability, visitor confidence, entry conditions or holiday patterns in one country can influence demand in another.
However, bilateral visitor flows should not be confused with proof that travellers are choosing one destination over another.
Visitor motivations, available leave, exchange rates, access arrangements and spending habits differ considerably between markets.
The common commercial challenge is to attract suitable visitors and provide experiences that encourage meaningful expenditure across the tourism economy.
Original Analysis: Why the Visitor Spending Gap Could Reshape Asian Tourism
The most revealing finding from these official datasets is not which country attracts the greatest number of tourists. It is how differently tourism revenue responds to visitor growth.
South Korea’s card-spending figures suggest stronger transaction growth than arrivals, but they do not establish how much total expenditure each traveller generated. Japan’s survey offers a more direct per-visitor spending measure, although it covers a different reporting period.
Advertisement
Advertisement
Malaysia demonstrates the importance of visitor classification. An overnight tourist generated approximately RM4,483 in recorded expenditure in 2025, compared with RM355 for a same-day visitor. That does not make short visits economically unimportant. It shows that the composition of visitor demand can materially change a national average.
Thailand adds a strategic example. Longer stays, wellness experiences and potential spending during transit periods create opportunities to increase tourism receipts without relying solely on more arrivals.
China illustrates the importance of removing barriers to spending through access, payments and visitor services.
Taken together, these findings suggest that the next useful measure of Asian tourism performance will combine visitor arrivals, expenditure per visitor, length of stay and the distribution of revenue across destinations.
A country could record slower arrival growth yet improve tourism income if visitors spend more. Equally, strong arrivals could conceal weaker economic performance if average spending falls.
Tourism businesses therefore need to examine customer value, not simply customer volume.
Advertisement
Advertisement
What This Means for Travellers, Hotels, Transport Providers and MICE
For travellers, the change could mean a wider selection of themed itineraries, wellness holidays, cultural activities and regional experiences.
It does not necessarily mean that every destination will become more expensive. Higher expenditure per trip can reflect longer stays, more activities or different visitor preferences rather than a general increase in prices.
For hotels, the most useful commercial indicators include average room rates, occupancy, revenue per available room, length of stay and the proportion of expenditure retained by the local economy.
For transport providers, improved regional connectivity can help distribute visitors beyond major gateways and extend the economic benefits of tourism to smaller destinations.
For the meetings, incentives, conferences and exhibitions sector, the trend creates an opportunity to link business events with additional accommodation nights, leisure extensions and organised destination experiences.
However, the evidence examined here does not establish a comparable five-country MICE spending trend. That would require separate official business tourism datasets.
Advertisement
Advertisement
The wider operational lesson is that destinations must improve infrastructure and visitor services while protecting environmental conditions, local communities and the quality of the tourism experience.
Critical Operational Takeaways for Travel Agents and Tour Operators
- Measure expenditure per traveller: Compare average booking value, trip duration and destination spending alongside the number of passengers handled.
- Separate overnight and same-day demand: Use the Malaysian statistical example to avoid treating all international border crossings as equally valuable tourism visits.
- Build longer and more varied itineraries: Combine principal cities with secondary destinations where transport links, accommodation capacity and visitor services support reliable travel.
- Monitor visa and entry policies: Verify each traveller’s eligibility directly against the relevant immigration authority, especially when using transit or multiple-entry arrangements.
- Protect against currency and pricing risks: Review exchange-rate movements, supplier contracts, seasonal rates and booking margins before assuming rising tourism expenditure represents higher profits.
- Assess premium demand carefully: Test wellness, cultural, family and special-interest products against demonstrated customer preferences rather than assuming every market wants luxury packages.
- Track source-market concentration: Avoid dependence on one inbound market by examining changes in regional visitor flows and travel demand.
- Treat proposed tourism schemes as unconfirmed products: Do not sell access to a new transit experience or visitor programme until its operating arrangements, eligibility conditions and booking process are officially established.
Asia’s Long-Term Tourism Growth Will Depend on What Visitors Spend and Experience
The latest official figures point towards a more complex period for Asian tourism.
Japan is pursuing higher expenditure and wider regional tourism benefits. South Korea is combining rapid arrival growth with stronger recorded tourism-related card spending. China is developing services that make international travel easier, while Thailand is placing greater weight on high-value experiences.
Malaysia’s detailed accounts provide an important reminder that visitor type and length of stay can change the economic meaning of arrival statistics.
These developments do not prove that a single regional competition has been formally declared, or that higher spending will continue at the same rate.
They do show why tourism revenue, spending per visitor, market composition and destination capacity are becoming essential indicators for understanding international travel growth.
Advertisement
Advertisement
For the global travel industry, the next phase of tourism performance in Asia may depend less on how many visitors cross a border and more on the economic and social value created during their stay.
FAQs
1. Which five countries are involved in the Asian tourism spending comparison?
The analysis covers Japan, South Korea, China, Thailand and Malaysia. They are major Asian tourism markets with different visitor growth patterns, spending trends and tourism development strategies. Their shared connection is the importance of measuring tourism revenue alongside international arrivals.
2. Is South Korea recording faster spending growth than visitor growth in 2026?
Yes, according to its official January–August 2026 figures. International arrivals increased 21.6%, while tourism-related foreign card spending rose 48.5%. However, the card-spending measure does not cover all possible tourism expenditure and should not be treated as a complete national spending survey.
3. Why is Japan’s tourism spending per visitor important in 2026?
Japan’s official survey recorded approximately ¥245,000 in expenditure per general foreign visitor during April–June 2026, an increase of 3.4% year on year. This demonstrates why expenditure per visitor is a useful additional measure of tourism performance.
4. Does Malaysia’s total visitor count include people who do not stay overnight?
Yes. Malaysia’s inbound visitor statistics include overnight tourists and same-day excursionists. In 2025, the two groups generated markedly different levels of expenditure, making visitor classification essential when calculating spending per arrival.
5. Does higher tourism spending automatically mean a destination is attracting wealthier travellers?
No. Average spending can increase because visitors stay longer, buy additional experiences, face higher prices or come from different source markets. To establish whether wealthier travellers are driving growth, destinations need additional evidence on visitor profiles, purchasing patterns, travel purposes and length of stay.
Advertisement
