
Florida Joins Tennessee and More in a Strong Role in Fueling US Tourism as Great Smoky Mountains National Park Heads Towards Another Record-Breaking Year With Strong Visitor Demand in 2026

Published
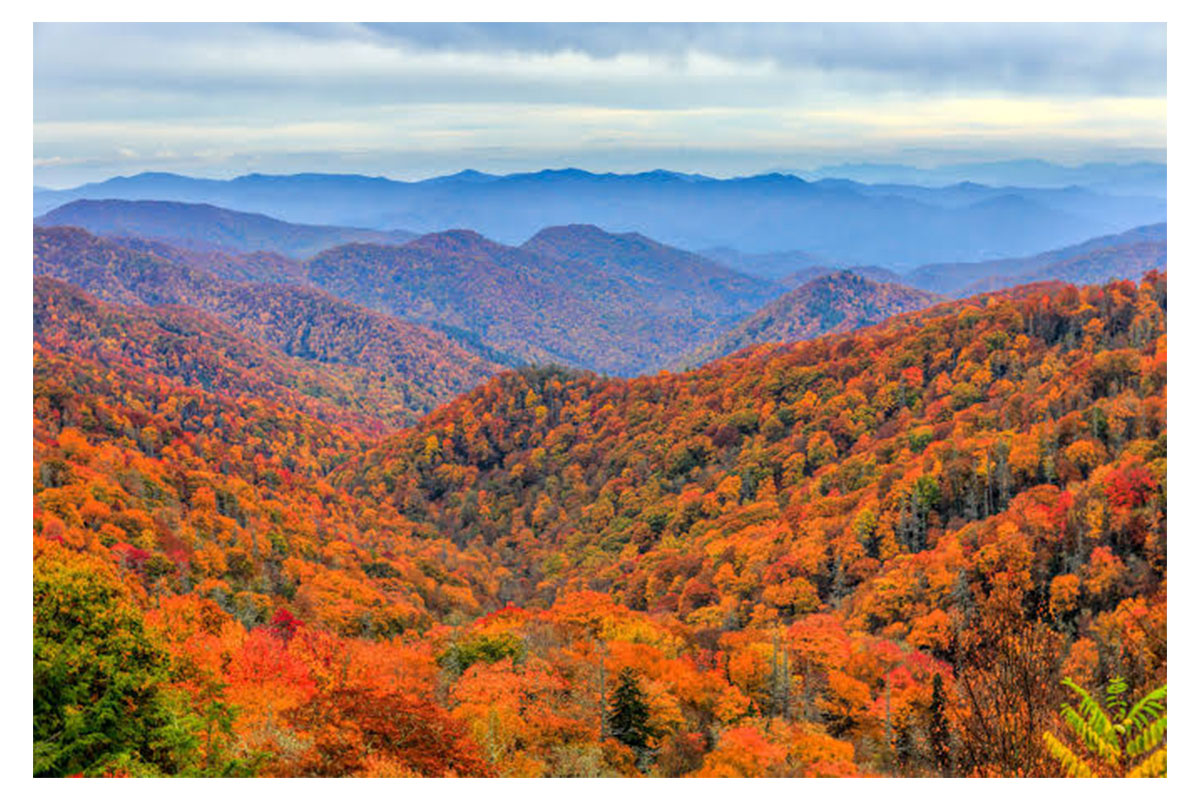
Late 2026 reports show a surge in domestic and international travel in the US. What’s more, major travel destinations, like Tennessee and Florida, have boosted interstate tourism with new infrastructure projects, airline industry projects, and other recreation projects. As a result, other travel destinations take a backseat. For example, the National Park Service expects Great Smoky Mountains National Park will again be the most visited national park for 2026. Since tourism plays a significant role in the national economy, understanding travel and tourism helps identify economic development policies and tendencies of the American people. Additionally, it shows how strictly the national government is managing protected land and helps prioritize recreational projects and conservation efforts.
Executive Summary: Assessing the Drivers of National Travel Expansion
Official data published by the National Travel and Tourism Office (NTTO), the U.S. Department of Commerce, and state-level tourism departments confirm that the American travel sector has entered a highly resilient phase. Amid shifting economic conditions and evolving consumer priorities, leisure travel and outdoor recreation have proven to be cornerstone economic drivers. The year 2026 has witnessed remarkable performance metrics across both coastal and inland destinations, with Florida and Tennessee emerging as primary engines of regional and national growth.
The synergy between high-density urban/resort destinations and natural heritage sites is particularly striking. While Florida continues to draw millions through its world-class aviation hubs, cruise terminals, and hospitality infrastructure, Tennessee has capitalised on its unique position as the premier gateway to eastern America’s outdoor assets. Anchoring Tennessee’s success is Great Smoky Mountains National Park, which is tracking towards historical visitation records based on monthly entry metrics logged by the National Park Service (NPS).
+-----------------------------------------------------------------------------------+
|                        Key National Tourism Indicators (2026)                    |
+------------------------------------+----------------------------------------------+
| Metric Sector                      | Verified Government Source & Direction       |
+------------------------------------+----------------------------------------------+
| National Park Service Visitation   | Upward trajectory; Great Smoky Mountains     |
|                                    | leading with >13 million annualized visits   |
+------------------------------------+----------------------------------------------+
| Outdoor Recreation GDP Contribution| U.S. Bureau of Economic Analysis (BEA)       |
|                                    | records steady year-on-year expansion        |
+------------------------------------+----------------------------------------------+
| Florida Statewide Visitor Volume   | Visit Florida reports record quarterly       |
|                                    | domestic and inbound aviation pass-throughs  |
+------------------------------------+----------------------------------------------+
| Tennessee Tourism Tax Receipts     | Tennessee Dept of Revenue confirms sustained |
|                                    | local and state sales tax gains             |
+------------------------------------+----------------------------------------------+
Macroeconomic Travel Indicators and Federal Data Trends
According to macro-level statistics compiled by the U.S. Bureau of Economic Analysis (BEA) through its Outdoor Recreation Satellite Account, outdoor recreation generates hundreds of billions of dollars in gross domestic product (GDP) annually, accounting for over 2% of the total US economy. In 2026, this sector has shown marked stability, outperforming several traditional retail sectors.
Advertisement
Advertisement
Federal transport metrics from the Federal Aviation Administration (FAA) and the Transportation Security Administration (TSA) further substantiate this trend. Throughput figures at major southeastern aviation gateways—including Orlando International Airport (MCO), Miami International Airport (MIA), Tampa International Airport (TPA), and Nashville International Airport (BNA)—have consistently broken daily and monthly passenger records throughout the first three quarters of 2026. This transportation surge underlines a broader national movement towards experience-based expenditure.
Regional Powerhouses Leading National Expansion
While regional travel recovery was initially marked by localized rebounds, the data in 2026 reveals a mature, structural expansion. Florida and Tennessee represent two distinct yet complementary models of destination success:
Advertisement
Advertisement
- Florida’s Diversified Resort Model: Combining world-class amusement infrastructure, extensive coastal management, and massive international gateway capacity.
- Tennessee’s Outdoor and Cultural Heritage Model: Blending urban music corridors in Nashville and Memphis with the overwhelming drawing power of the Southern Appalachian mountain range.
Together, these states demonstrate how coordinated public investments in highways, conservation, and destination marketing can generate compounding economic returns across state borders.
Historical Context: Evolution of Domestic Travel and Park Visitation
To fully comprehend the magnitude of current performance, it is necessary to examine the structural shifts in American travel patterns over the preceding decade. The period between 2020 and 2025 served as a transformative era for public land usage and regional road trips.
+-----------------------------------------------------------------------------------+
|              Historical Progression of Great Smoky Mountains Visitation           |
+----------------------+-----------------------+------------------------------------+
| Era / Period         | Approx. Annual Visits | Primary Operational Characteristics|
+----------------------+-----------------------+------------------------------------+
| Pre-2020 Baseline    | 11.5 - 12.5 Million   | Steady seasonal growth; traditional|
|                      |                       | summer peaks                       |
+----------------------+-----------------------+------------------------------------+
| 2020 - 2022 Surge    | 12.0 - 14.1 Million   | Outdoor shift; rapid adoption of   |
|                      |                       | digital tools & drive-in market    |
+----------------------+-----------------------+------------------------------------+
| 2023 - 2025 Stabl.   | 13.0 - 13.3 Million   | Formalisation of parking fees;     |
|                      |                       | corridor infrastructure upgrades   |
+----------------------+-----------------------+------------------------------------+
| 2026 Current Track   | Projecting Records    | Data-driven visitor management;    |
|                      | (>13.5 Million)       | year-round balanced demand         |
+----------------------+-----------------------+------------------------------------+
Post-Pandemic Consolidation and Long-Term Trends
When international travel experienced severe restrictions in the early 2020s, American consumers redirected their leisure budgets toward domestic drive-to destinations. Drive-market locations within a six-to-eight-hour radius of major population centers saw unprecedented influxes.
By 2024 and 2025, industry analysts questioned whether this surge in national park visitation would abate as long-haul international travel normalized. However, official National Park Service data from early 2026 confirms that the appetite for natural heritage sites has not merely persisted—it has codified into permanent consumer behaviour. The outdoor sector has established a higher baseline of annual attendance, supported by flexible working arrangements and enhanced public interest in health and wellness.
Federal Infrastructure Mandates and Conservation Frameworks
To cope with sustained high visitation, the federal government enacted significant legislative frameworks, including the Great American Outdoors Act (GAOA). This funding mechanism allocated billions of dollars to address deferred maintenance backfalls across national parks, national forests, and wildlife refuges.
In Great Smoky Mountains National Park, GAOA funding and targeted fee-retention programs have financed crucial upgrades:
Advertisement
Advertisement
- Rehabilitation of historic paved trails and primary vehicle thoroughfares such as Newfound Gap Road (US 441).
- Modernisation of wastewater processing facilities and visitor sanitary infrastructure.
- Digitalisation of parking management systems to reduce idling and environmental degradation.
Tennessee and Great Smoky Mountains: Breaking Records in 2026
Tennessee’s travel economy has emerged as one of the most dynamic in the southeastern United States. Supported by the Tennessee Department of Tourist Development, the state has positioned itself as a premier year-round hub. At the heart of this strategy is Great Smoky Mountains National Park visitation, which continues to set benchmark figures for the national park system.
+-----------------------------------------------------------------------------------+
|               Great Smoky Mountains National Park Operational Highlights           |
+----------------------------------+------------------------------------------------+
| Strategic Dimension              | Operational Detail & Impact                    |
+----------------------------------+------------------------------------------------+
| Primary Entry Corridors          | Gatlinburg, Pigeon Forge, Townsend (TN),       |
|                                  | and Cherokee (NC)                              |
+----------------------------------+------------------------------------------------+
| Key Infrastructure Initiative    | Park it Forward Parking Tag Program            |
|                                  | (100% funds retained locally for maintenance)  |
+----------------------------------+------------------------------------------------+
| Primary Visitor Demographics     | Drive-market visitors within 500 miles;        |
|                                  | expanding long-haul flywheel via BNA & TYS     |
+----------------------------------+------------------------------------------------+
| Direct Economic Output           | $1.5+ Billion annually generated in adjacent   |
|                                  | gateway communities                            |
+----------------------------------+------------------------------------------------+
Official National Park Service Visitation Metrics
Verified figures published in the National Park Service Visitor Use Statistics database demonstrate that Great Smoky Mountains National Park recorded extraordinary entry figures through the summer season of 2026. The park, which straddles the border between eastern Tennessee and western North Carolina, consistently draws more than double the annual visitation of the second-most visited park in the system (Grand Canyon National Park).
Key factors driving these record numbers include:
- No Entrance Fee Structure: Unlike many major western parks, the Smokies do not charge an entrance fee, maintaining open access across its main transportation arteries pursuant to historic land-deed agreements.
- Geographic Accessibility: Situated within a day’s drive for over 50% of the United States population, the park benefits from an unmatched regional catchment area.
- Extended Shoulder Seasons: Spring wildflower displays and late-autumn foliage viewing have effectively eliminated historic low-season dips, ensuring steady year-round traffic.
Traffic Distribution, Gateway Towns, and Local Revenue Multipliers
The economic footprint of the park extends well beyond its official boundaries. Gateway municipalities such as Gatlinburg, Pigeon Forge, and Townsend in Sevier County, Tennessee, serve as vital commercial corridors.
According to tax collection reports from the Tennessee Department of Revenue, local lodging tax revenues, local option sales taxes, and restaurant tax receipts in Sevier County reached all-time highs during the first two quarters of 2026.
+-----------------------------------------------------------------------------------+
|                  Economic Impact Breakdown: Gateway Municipalities                |
+-----------------------+------------------------+----------------------------------+
| Municipality          | Primary Tourism Asset  | Main Tax Contribution Sector     |
+-----------------------+------------------------+----------------------------------+
| Gatlinburg, TN        | Direct Park Boundary   | Lodging, Cabin Rentals, Retail   |
+-----------------------+------------------------+----------------------------------+
| Pigeon Forge, TN      | Family Entertainment   | Amusements, Hospitality, Dining  |
+-----------------------+------------------------+----------------------------------+
| Townsend, TN          | Peaceful Eco-Tourism   | Outdoor Outfitters, Bed & Bfasts |
+-----------------------+------------------------+----------------------------------+
| Cherokee, NC          | Cultural & Southern Entrance | Cultural Tourism, Gaming, Lodging|
+-----------------------+------------------------+----------------------------------+
The high density of accommodations—ranging from rustic campgrounds to luxury mountain cabins—allows the region to absorb millions of overnight stays. The financial turnover generated by these visits directly funds county-level public safety, infrastructure improvements, and public education systems.
Advertisement
Advertisement
Parking Tag Initiatives and Infrastructure Investment
To address maintenance requirements while keeping access open, the park implemented the “Park it Forward” parking tag scheme. Verified reports from the park administration confirm that 100% of the funds collected from parking tags remain directly within Great Smoky Mountains National Park.
In 2026, revenue from this initiative has been directed toward:
- Increasing presence of rangers and field staff for visitor safety and wildlife protection.
- Routine maintenance of over 800 miles of approved hiking trails.
- Upgrading trailheads and installing real-time parking availability indicators at congested sites such as Laurel Falls, Alum Cave, and Clingmans Dome (Kuwohi).
Florida’s Tourism Machine: Inbound Surge and Economic Performance
Simultaneously, Florida has demonstrated why it remains the cornerstone of American international and domestic travel. Data published by Visit Florida, the state’s official tourism marketing corporation, shows that Florida tourism statistics 2026 have established new historical benchmarks across key hospitality metrics.
+-----------------------------------------------------------------------------------+
|                      Florida Tourism Sector Metrics (2026 Data)                   |
+----------------------------------+------------------------------------------------+
| Operational Sector               | Measured Performance Indicator                 |
+----------------------------------+------------------------------------------------+
| Aviation Inbound Volume          | Record passenger counts across MCO, MIA, TPA   |
+----------------------------------+------------------------------------------------+
| Lodging Performance              | Sustained strength in ADR and RevPAR           |
+----------------------------------+------------------------------------------------+
| Cruise Port Operations           | PortMiami & Port Canaveral lead global volume  |
+----------------------------------+------------------------------------------------+
| State Sales Tax Contribution     | Tourism accounts for over 12% of total state   |
|                                  | sales tax collections                          |
+----------------------------------+------------------------------------------------+
Visit Florida Quarterly Reports and Domestic Inflows
Throughout 2026, Visit Florida reported robust growth in domestic visitation, driven largely by cold-weather markets in the Northeast and Midwest, alongside expanding intra-state travel. The state’s campaign strategies have successfully diversified visitor focus beyond traditional theme parks to include ecotourism along the Gulf Coast, springs regions in North Florida, and cultural heritage sites in St. Augustine and Pensacola.
Key findings from state tourism filings include:
- Domestic Volume: Over 30 million out-of-state domestic visitors recorded per quarter in peak seasons.
- Length of Stay: Increase in average visitor duration from 4.2 nights to 4.8 nights, raising the average spend per trip.
- Auto Travel Metrics: Drive-in tourism via Interstates 95 and 75 saw notable growth, supplementing air travel channels.
International Inbound Recovery and Aviation Analytics
On the international front, official figures from the U.S. Department of Commerce’s International Trade Administration show that international inbound travel to Florida hubs has made a complete recovery. Miami International Airport continues to serve as the dominant gateway for Latin American and Caribbean travel, while Orlando International Airport’s Terminal C expansion has enabled significant capacity growth for long-haul European carriers.
Advertisement
Advertisement
+-----------------------------------------------------------------------------------+
|               Florida Primary Aviation Hubs - Performance Overview                 |
+-------------------------+-------------------------+-------------------------------+
| Airport Facility        | Primary Market Focus    | Key 2026 Infrastructure Growth |
+-------------------------+-------------------------+-------------------------------+
| Miami International     | International / S. Amer | Cargo & Terminal Modernisation|
+-------------------------+-------------------------+-------------------------------+
| Orlando International   | Family / Leisure / Intl | Terminal C Expansion Operations|
+-------------------------+-------------------------+-------------------------------+
| Tampa International     | Domestic / European     | Airside D Construction Progress|
+-------------------------+-------------------------+-------------------------------+
| Fort Lauderdale-Hollywood| Low-Cost / Regional    | Runway & Terminal Upgrades    |
+-------------------------+-------------------------+-------------------------------+
The revitalization of long-haul international corridors has yielded higher average daily expenditure figures. International visitors typically spend more on lodging, dining, and retail compared to domestic counterparts, directly bolstering local municipal sales tax receipts.
Hotel Occupancy, ADR, and RevPAR Indicators
According to hospitality performance tracking verified by the Florida Department of Revenue, the state’s hotel sector has maintained remarkable pricing power. Key performance indicators (KPIs) include:
- Average Daily Rate (ADR): High-demand luxury coastal regions (e.g., Naples, Palm Beach, Florida Keys) maintained record-high ADRs.
- Revenue Per Available Room (RevPAR): Driven by strong occupancies in urban and resort sub-markets, RevPAR across the state showed mid-single-digit growth year-over-year.
- Short-Term Rental Market: Vacation rental inventory expanded to meet consumer demand for flexible multi-bedroom accommodations, particularly in central Florida and coastal panhandle regions.
Inter-State Synergies: The Southeast Travel Corridor
A key finding in 2026 travel pattern research is the growing prevalence of multi-destination, inter-state itineraries across the American Southeast. Rather than treating states as isolated destinations, travellers increasingly combine regional assets.
+-----------------------------------------------------------------------------------+
|                       The Southeast Interstate Travel Network                      |
+--------------------+-----------------------+--------------------------------------+
| Route Corridor     | Geographic Connectors | Tourism Synergy                      |
+--------------------+-----------------------+--------------------------------------+
| Interstate 75      | FL -> GA -> TN        | Connects Florida beach/urban hubs to |
|                    |                       | Tennessee mountain outdoor areas     |
+--------------------+-----------------------+--------------------------------------+
| Interstate 95      | FL -> GA -> SC        | Coastal heritage route linking east  |
|                    |                       | coast population centres             |
+--------------------+-----------------------+--------------------------------------+
| Interstate 40      | NC -> TN -> AR        | Primary east-west outdoor and music  |
|                    |                       | heritage transport artery            |
+--------------------+-----------------------+--------------------------------------+
Highway Corridors and Drive-Market Expansion
The Interstate 75 corridor serves as a vital economic artery connecting Florida, Georgia, and Tennessee. Travel survey data published by regional planning commissions indicates a significant volume of dual-destination road trips. A prominent pattern includes families spending time at Florida’s coastal or central attractions before driving north through Atlanta to spend a second week in the Great Smoky Mountains of Tennessee.
This inter-state drive-market flow offers substantial benefits:
- It distributes tourism spending to rural highway communities located along interstate corridors.
- It reduces seasonal volatility by balancing coastal summer vacations with mountain autumn foliage tours.
- It supports regional roadside infrastructure, service plazas, and vehicle charging networks.
Collaborative Regional Marketing Initiatives
Recognising these synergies, state tourism boards have increasingly harmonised their data-sharing and promotional frameworks. Initiatives supported by Travel South USA—the official regional tourism organization promoting southern states—highlight multi-state outdoor and cultural road trips. These efforts emphasize:
Advertisement
Advertisement
- The civil rights history trail linking southern urban centers.
- Natural heritage routes spanning from the Everglades National Park in Florida to the Great Smoky Mountains National Park in Tennessee.
- Culinary and musical corridors that showcase the distinct cultural heritage of the Southeast.
Policy Implications and Federal Land Management
The growth in visitor volumes brings complex administrative and environmental challenges. Federal, state, and local agencies must balance economic development with ecological conservation and community liveability.
+-----------------------------------------------------------------------------------+
|               Federal Land Management Challenges and Policy Responses             |
+----------------------------------+------------------------------------------------+
| Policy Challenge                 | Government Strategic Response                  |
+----------------------------------+------------------------------------------------+
| Trail and Habitat Erosion        | Sustainable trail construction & bio-restoration|
+----------------------------------+------------------------------------------------+
| Traffic Congestion at Peak Hours | Digital parking management & timed access      |
+----------------------------------+------------------------------------------------+
| Gateway Housing Affordability    | Workforce housing initiatives & local zoning   |
+----------------------------------+------------------------------------------------+
| Infrastructure Funding Gaps      | Local fee-retention programs (e.g., GAOA)     |
+----------------------------------+------------------------------------------------+
Balancing High Visitor Volumes with Ecological Conservation
The National Park Service operates under a dual mandate established by the Organic Act of 1916: to conserve park resources and to provide for public enjoyment. In Great Smoky Mountains National Park, managing over 13 million annual visits tests the limits of this mandate.
The Park Service has adopted several adaptive management strategies:
- Vegetation Protection: Installing boardwalks and protective barriers in high-sensitivity ecosystems such as high-elevation spruce-fir forests and delicate riverbanks.
- Wildlife Management: Expanding bear-proof waste disposal infrastructure across all park facilities to prevent human-wildlife conflicts.
- Search and Rescue (SAR) Resourcing: Increasing preventative search-and-rescue education at popular trailheads to reduce emergency incidents.
Smart Mobility and Data-Driven Congestion Control
Modern public land management increasingly relies on data technology to smooth peak traffic demand. Collaborations between the Federal Highway Administration (FHWA) and state departments of transportation (e.g., TDOT in Tennessee) have introduced intelligent transportation systems (ITS) in and around the park.
Key technological implementations include:
- Dynamic Messaging Systems (DMS): Displaying real-time parking status before visitors enter narrow mountain valleys.
- Mobile Apps and Web Portals: Providing live webcams at major entrance stations to encourage off-peak visits.
- Electric Vehicle (EV) Charging Networks: Expanding charging infrastructure at gateway visitor centres through National Electric Vehicle Infrastructure (NEVI) formula funding.
Economic Multipliers, Job Creation, and Local Tax Impact
The national travel expansion generates far-reaching economic impacts, supporting millions of jobs and contributing significantly to local and state tax bases.
Advertisement
Advertisement
+-----------------------------------------------------------------------------------+
|             Economic Contribution Profile: Outdoor vs Urban Tourism               |
+-----------------------+---------------------------+-------------------------------+
| Impact Category       | Outdoor Recreation Sector | Resort & Urban Sector         |
+-----------------------+---------------------------+-------------------------------+
| Direct Job Creation   | Outfitters, Guides, Park  | Hotel Staff, Theme Parks,     |
|                       | Staff, Local Hospitality  | Airport Operations, Retail    |
+-----------------------+---------------------------+-------------------------------+
| Indirect Benefits     | Equipment Manufacturers,  | Food Wholesalers, Construction|
|                       | Vehicle Rentals, Agritour | Aviation Maintenance          |
+-----------------------+---------------------------+-------------------------------+
| Tax Base Contribution | Local Lodging Tax, State  | Municipal Sales Tax, Resort   |
|                       | Fuel Taxes, Sales Tax     | Surcharges, Corporate Tax     |
+-----------------------+---------------------------+-------------------------------+
Direct and Indirect Economic Output
According to the U.S. Travel Association and data verified by state economic development agencies, every dollar spent by a leisure traveler generates a broad economic ripple effect.
- Direct Impact: Direct purchases at hotels, restaurants, fuel stations, and attraction sites.
- Indirect Impact: B2B supply chain transactions, such as food distributors supplying resort kitchens or construction firms building new lodging infrastructure.
- Induced Impact: Household spending by employees working directly or indirectly within the hospitality industry.
In Tennessee, Tennessee tourism economic impact studies indicate that travel-generated revenue reduces the overall tax burden on local households by offsetting municipal operational expenses. Similarly, in Florida, the absence of a state personal income tax is enabled in part by heavy reliance on state sales taxes paid by out-of-state visitors.
Gateway Community Transformation and Local Business Vitality
Small businesses form the backbone of the economy in national park gateway towns. Independent outfitters, local craft breweries, artisanal markets, and family-owned restaurants benefit directly from the visitor influx.
However, rapid growth also requires careful community planning. Municipalities like Gatlinburg and Pigeon Forge face unique challenges:
- Workforce Housing: Providing affordable housing options for seasonal and permanent hospitality employees.
- Municipal Infrastructure: Upgrading water, sewer, and emergency services to handle peak populations that can be ten times larger than the resident base.
- Zoning Policies: Balancing commercial development with the preservation of rural mountain character.
Future Projections and Long-Term Strategic Planning
Looking ahead to the late 2020s, official projections from tourism research bureaus suggest that the Southeast corridor will maintain its leadership position in national travel growth.
+-----------------------------------------------------------------------------------+
|               Strategic Projections for Southeastern US Tourism                   |
+----------------------------------+------------------------------------------------+
| Long-Term Objective              | Implementation Horizon                         |
+----------------------------------+------------------------------------------------+
| Sustainable Mobility Integration | Multi-modal transit studies for park gateways  |
+----------------------------------+------------------------------------------------+
| Year-Round Seasonality Smoothing  | Promotion of winter cultural & indoor assets   |
+----------------------------------+------------------------------------------------+
| Resilient Aviation Infrastructure| Terminal expansions & international direct routes|
+----------------------------------+------------------------------------------------+
| Enhanced Conservation Funding    | Public-private stewardship partnerships        |
+----------------------------------+------------------------------------------------+
Capacity Planning and Infrastructure Pipelines
To sustain this growth rate without diminishing visitor experience or natural resources, state and federal bodies are advancing long-term strategic plans:
Advertisement
Advertisement
- Tennessee Corridor Improvements: The Tennessee Department of Transportation is executing targeted safety and capacity upgrades along US 441 and State Route 66, improving flow from Interstate 40 into Sevier County.
- Florida Airport Modernisation: Ongoing multi-billion-dollar capital improvement programs across major Florida hubs will expand international gate capacity and integrate high-speed passenger rail networks.
- National Park Sustainable Visitor Frameworks: The NPS continues to refine its visitor use management frameworks, relying on spatial tracking data to distribute visitors across lesser-known trails and park sections.
Evolving Consumer Preferences
Future market demand will increasingly reflect changing demographic preferences. Younger demographics prioritize sustainable, experiential travel, eco-certified lodging, and active outdoor pursuits. Both Florida and Tennessee are well-positioned to capture these demographics by combining pristine natural resources with modern, accessible infrastructure.
By aligning state-level tourism marketing with federal conservation stewardship, Florida and Tennessee demonstrate how strategic investment and sustainable policy can drive long-term US tourism growth 2026 while protecting precious natural heritage for future generations.
Advertisement
