
China Joins Indonesia and Other Major Markets as Travel Spending Soars Beyond Visitor Growth Across Asia

Published
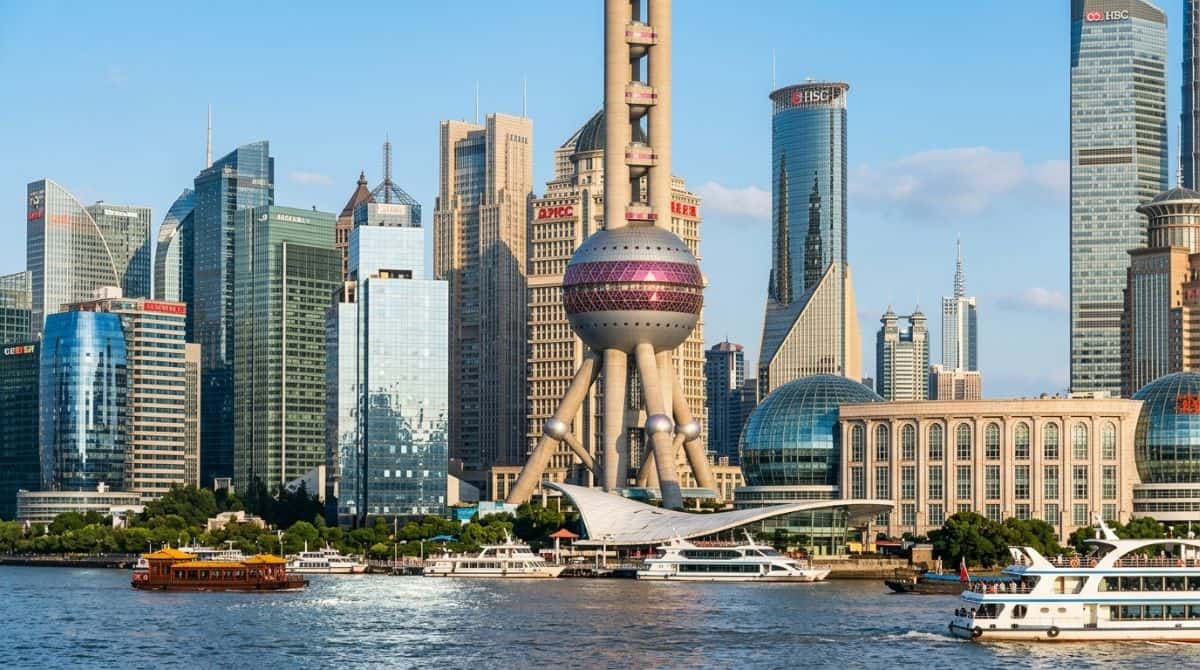
Image generated with Ai
Asia’s tourism race is changing fast. China’s Macao SAR, Indonesia, Japan, Vietnam and Singapore are showing that the real power of tourism in 2026 lies increasingly in what travellers spend, where they stay and how deeply their money moves through local economies—not simply in how many people arrive. Official data reveal a striking pattern: Japan’s domestic tourism spending is rising far faster than trip numbers, Singapore’s hotel revenue has climbed despite fewer international visitors, Macao is extracting significantly more value from shopping and business travel, Vietnam is converting rapid visitor growth into even faster revenue expansion, and Indonesia’s huge domestic market is keeping hotels resilient.
Asia Tourism 2026 Shifts From Record Arrivals to Higher Visitor Spending
Tourist arrivals still matter. They show demand, connectivity and destination popularity. But arrival totals cannot reveal whether travellers stay one night or seven, book budget rooms or premium hotels, eat locally, attend events, shop, explore secondary destinations or spend money on cultural experiences.
Advertisement
Advertisement
That is why tourism performance increasingly depends on a broader set of indicators:
- Tourism spending per trip
- Hotel occupancy and room revenue
- Average room rates
- Visitor expenditure
- Business and MICE spending
- Domestic tourism demand
- Shopping, dining and entertainment activity
- Length and quality of stay
For travellers, the change is highly relevant. Destinations chasing greater tourism value tend to invest more heavily in hotels, transport, restaurants, attractions, events and experiences designed to encourage people to stay longer and do more.
Advertisement
Advertisement
Asia’s Travel Value Race at a Glance
| Market | Latest official value indicator | Volume trend | What stands out |
|---|---|---|---|
| China — Macao SAR | H1 non-gaming spending MOP44.47bn, +17.4% | July arrivals +2.4% | Spending is rising far faster than arrivals |
| Japan | Q2 domestic spending ¥7.5361tn, +11.7% | Trips +3.3% | Travellers are generating more value per journey |
| Singapore | June hotel room revenue about S$396m, +5.8% | International arrivals about -4.9% | Hotel earnings rose despite fewer foreign visitors |
| Vietnam — HCMC | Jan–Jul tourism revenue VND237.466tn, +55.3% | International visitors +42.7% | Revenue is outpacing visitor growth |
| Indonesia | Star-hotel occupancy 54.28% | Foreign arrivals -2.15% | Domestic travel is supporting hotel demand |
China’s Macao Tourism Spending Boom Reveals the Power of High-Value Visitors
Macao provides one of Asia’s strongest examples of why visitor spending can tell a more powerful story than headcounts.
Advertisement
Advertisement
The Macao Statistics and Census Service reported MOP44.47 billion in non-gaming visitor expenditure during the first half of 2026, up 17.4% year on year.
Average spending reached MOP2,123 per visitor, an increase of 7.8%.
Same-day visitors created the biggest surprise. Their total spending surged 53.5% to MOP12.05 billion, while expenditure per person jumped 33.2% to MOP935.
Advertisement
Advertisement
Overnight guests remained considerably more valuable individually, spending an average MOP4,024 each.
Where Macao Visitors Spend Their Money
| Category | Share of non-gaming expenditure |
|---|---|
| Shopping | 46.0% |
| Accommodation | 22.3% |
| Food and beverages | 21.5% |
The pattern matters because July arrivals increased only 2.4% to 3.54 million, while overnight visitor numbers declined 2.9%.
Advertisement
Advertisement
The gap between spending growth and visitor growth shows something important: Macao does not need an equally dramatic rise in arrivals to generate stronger tourism returns.
Macao MICE Tourism Turns Fewer Events Into Much Bigger Economic Value
Business tourism strengthens that argument.
Macao hosted 918 MICE events in the first half of 2026. Event numbers barely changed, yet attendance increased 16% to 494,000.
More importantly, non-gaming receipts linked to MICE activity climbed 44.8% to around MOP2.43 billion.
MICE visitors spent an average MOP4,593 per person, more than twice Macao’s overall visitor average.
Advertisement
Advertisement
Second-quarter performance sharpened the contrast:
- 499 MICE events
- 314,000 participants and attendees
- Attendance up 37.6%
- MICE-related non-gaming receipts of MOP1.59 billion
- Revenue growth of 54.8%
This is one of the clearest examples of tourism yield in action. Event numbers stayed flat, but attendance and spending accelerated.
The impact extends beyond conference halls. MICE demand can strengthen weekday hotel occupancy, restaurants, premium transport, entertainment venues and retail districts.
Japan Tourism Spending Surges as Each Domestic Trip Carries More Value
Japan offers perhaps the cleanest statistical proof that spending can outpace trip growth.
The Japan Tourism Agency recorded ¥7.5361 trillion in domestic travel expenditure during the second quarter of 2026, an increase of 11.7%.
Advertisement
Advertisement
Domestic traveller trips rose only 3.3% to 149.58 million.
Average spending per trip increased 8.2% to ¥50,381.
Japan’s Spending Growth Versus Trip Growth
| Indicator | Year-on-year change |
|---|---|
| Domestic tourism expenditure | +11.7% |
| Domestic traveller trips | +3.3% |
| Spending per trip | +8.2% |
That gap changes the tourism story completely.
Japan is not merely generating more journeys. Each journey is carrying more economic weight.
The official data do not identify a single reason. Higher accommodation prices, transport expenditure, dining, activities and different trip patterns can all contribute.
Advertisement
Advertisement
For travellers, the trend also provides a warning: strong spending per trip can translate into firmer hotel pricing and greater demand for popular experiences, particularly during peak travel periods.
Singapore Hotels Defy Falling Arrivals as Room Revenue Climbs
Singapore delivers perhaps the most striking hotel-market contrast among the five destinations.
Singapore Tourism Board data show gazetted hotels generated about S$396 million in room revenue in June 2026, roughly 5.8% more than a year earlier.
Hotel performance strengthened across key indicators:
- Average room rate increased from S$253.90 to S$261.30
- Occupancy rose from 75.1% to 76.3%
- Room revenue increased around 5.8%
Yet international visitor arrivals moved in the opposite direction.
Advertisement
Advertisement
Singapore welcomed 1,184,526 international visitors in June 2026, down from 1,245,947 in June 2025, a decline of approximately 4.9%.
| Singapore tourism indicator | Approximate YoY movement |
|---|---|
| International arrivals | -4.9% |
| Average room rate | +2.9% |
| Hotel occupancy | +1.2 percentage points |
| Hotel room revenue | +5.8% |
The practical takeaway is powerful: fewer international visitors do not automatically mean weaker hotel demand or cheaper rooms.
Events, domestic stays, length of stay, visitor mix and available room supply can all keep hotel economics strong.
Vietnam Tourism Revenue Accelerates Faster Than Visitor Growth
Vietnam is following another route. Visitor numbers are booming, but tourism revenue is increasing even faster in Ho Chi Minh City.
The city welcomed more than 7.13 million international visitors during January–July 2026, up 42.7% year on year.
Advertisement
Advertisement
Domestic visitor numbers approached 31.7 million.
Tourism revenue surged 55.3% to an estimated VND237.466 trillion, already reaching around 72% of the city’s annual target.
Ho Chi Minh City is aiming for VND330 trillion in tourism revenue in 2026.
Nationally, Vietnam welcomed 13.9 million international visitors during the first seven months, up 13.8%, including about 1.67 million in July.
Vietnam therefore faces an opportunity that many destinations would welcome: demand is already strong. The next challenge is to turn that momentum into deeper visitor engagement.
Advertisement
Advertisement
That means expanding:
- Culinary and food tourism
- Night-time experiences
- Cultural attractions
- Shopping
- Premium accommodation
- Events and MICE
- Multi-destination itineraries
The strategic opportunity lies in increasing the economic value of each visit without allowing headline growth to overwhelm infrastructure or dilute the visitor experience.
Indonesia’s Domestic Travel Strength Keeps Hotels Resilient
Indonesia tells a different story.
Statistics Indonesia recorded 1.39 million international visitor arrivals in June 2026, down 2.15% year on year.
Domestic travellers, however, made 107.19 million trips, an increase of 1.98%.
Advertisement
Advertisement
Star-rated hotel occupancy reached 54.28%, rising by 4.30 percentage points from a year earlier.
Indonesia Tourism Demand Snapshot
| Indicator | June 2026 |
|---|---|
| International arrivals | 1.39 million |
| International arrival growth | -2.15% |
| Domestic tourist trips | 107.19 million |
| Domestic trip growth | +1.98% |
| Star-hotel occupancy | 54.28% |
| Occupancy change | +4.30 percentage points |
Indonesia’s data do not establish that domestic travellers are spending more individually. They show something strategically different: a vast home market can keep tourism businesses active when international demand weakens.
That reduces dependence on overseas arrivals and can make hotel demand more resilient throughout the year.
What Asia’s Higher-Value Tourism Shift Means for Travellers
The move from volume to value can change how travellers experience Asia.
Destinations generating stronger tourism yields can channel more investment into:
Advertisement
Advertisement
- Better hotels and renovated properties
- Faster and more reliable transport
- Improved visitor attractions
- Stronger restaurant and nightlife districts
- Premium cultural experiences
- Events and exhibitions
- Secondary destinations beyond major gateways
But strong tourism economics can also create new pressures.
Travellers may face higher room rates, tighter availability around major events and stronger competition from domestic tourists during popular periods.
That makes timing, neighbourhood choice and secondary destinations increasingly important when planning value-conscious trips.
Asia’s New Tourism Winners Will Be Defined by Value, Not Just Crowds
China’s Macao SAR, Japan, Singapore, Vietnam and Indonesia are taking very different routes through the 2026 tourism market, but the official figures point towards the same fundamental change.
Macao is extracting far more value from shopping, same-day visitors and MICE. Japan is generating spending growth far beyond its increase in domestic trips. Singapore’s hotels are producing stronger revenue despite fewer international arrivals. Vietnam is turning fast visitor growth into even faster tourism earnings. Indonesia is using its enormous domestic market to strengthen hotel resilience.
Advertisement
Advertisement
Together, they expose the weakness of judging tourism success by arrivals alone.
The next phase of Asia’s tourism boom will belong to destinations that turn each journey into greater value — through better stays, stronger experiences, wider local spending and healthier tourism businesses.
For travellers, that shift can mean richer experiences and better infrastructure. For destinations, it means the winning question is no longer simply “How many visitors arrived?”
It is “How much value did every journey create?”
In conclusion, China joins Indonesia and other major markets as travel spending soars beyond visitor growth across Asia, because tourism value is increasingly being driven by what travellers spend, where they stay and how widely their money supports local economies. The same trend is visible in Macao’s non-gaming spend, a higher spend per trip in Japan, the steady hotel revenue in Singapore, a quickening of tourism earnings in Vietnam and their home market demand in Indonesia. Visitors are important, but they’re not the full picture. Globally, across Asia, places that develop greater value in their tourism and greater experiences and performance of the Hotel sector are attracting more tourism value than places that are based on increased numbers of heads.
Advertisement
