
Bali Stands Alongside Phuket as Hokkaido Highlights Asia’s Changing Tourism Calendar, Where Weather Extremes, Hotel Rates and Visitor Surges Shape Holiday Decisions

Published
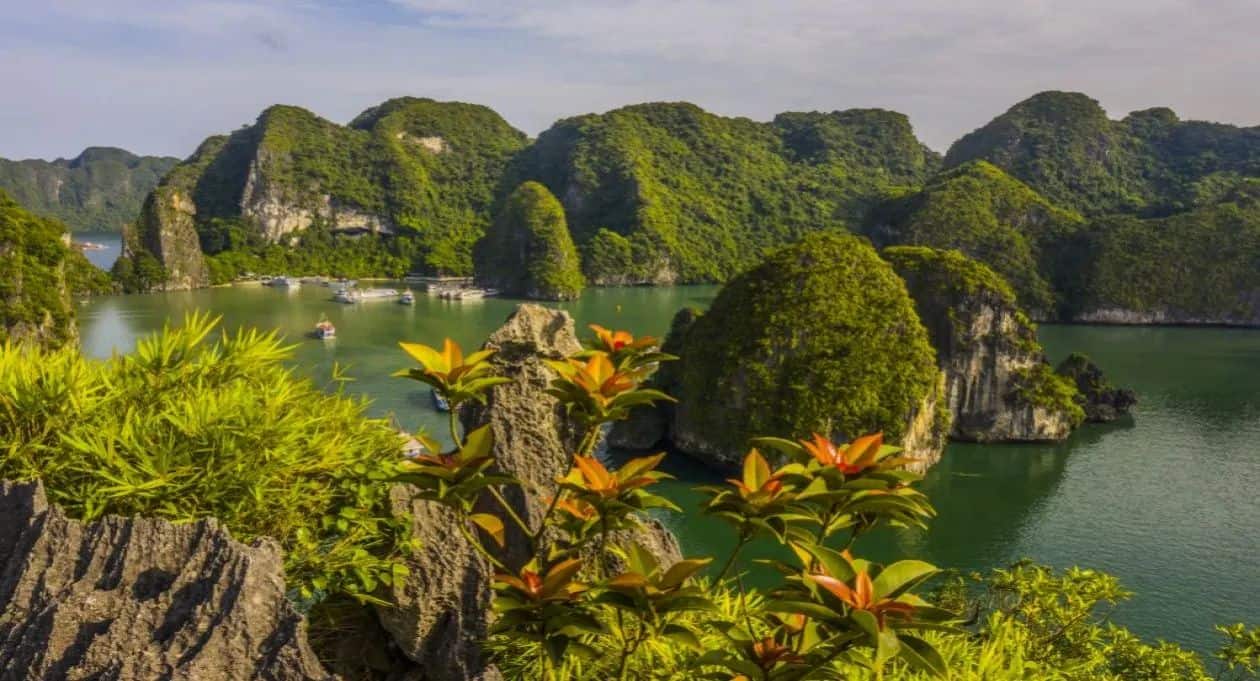
Bali, Phuket, Hokkaido and Sabah are exposing four distinct sides of Asia’s changing holiday economy, where seasonal weather, hotel prices and tourist demand increasingly shape when travellers visit and how much they spend. Bali recorded 6.95 million direct foreign tourist arrivals in 2025, up 9.72% year on year, while Sabah welcomed 3.79 million visitors and generated RM8.74 billion in tourism receipts. Phuket’s hotel market, meanwhile, recorded softer occupancy and average room rates in 2025, while Hokkaido continued to attract growing international demand. These contrasting trends highlight a crucial choice for travellers: whether to pay peak-season premiums for preferred conditions or seek better value during quieter periods. Yet rainfall, snow conditions and extreme-weather disruptions can change the equation, making monthly arrivals, accommodation costs and activity-specific weather risks essential measures when comparing these four destinations.
Four Destinations, Four Seasonal Economies
Asian holiday planning is becoming a more complex calculation for travellers weighing favourable weather against accommodation costs, crowding and disruption. Bali received 6,948,754 direct foreign tourist arrivals in 2025, up 9.72% from 2024. Sabah recorded 3,793,709 visitor arrivals and RM8.74 billion in tourism receipts during the same year. Meanwhile, Phuket’s hotel market experienced softer annual performance, while Hokkaido continued to attract growing international demand alongside concerns about seasonal and regional imbalances. These contrasting results reveal why travellers should examine each destination’s tourism calendar separately. Rainfall, hotel occupancy and visitor numbers offer useful clues, but none alone determines the best time to travel.
The four destinations also differ in what travellers expect from them. Bali and Phuket rely heavily on coastal holidays, although their rainfall patterns and marine conditions differ. Hokkaido has distinct winter and summer tourism markets, while Sabah combines island excursions, diving, wildlife experiences and highland adventures. Consequently, a month that suits one activity may offer poor conditions for another, even within the same destination.
Bali’s Dry-Season Premium Meets Rising Demand
Bali’s tourism figures show how strongly the island continues to attract international visitors. Statistics Indonesia recorded 6.95 million direct foreign tourist arrivals in 2025, an increase of 9.72% year on year. Australian visitors accounted for 23.44% of those arrivals, underlining the importance of regional air connectivity and established source markets.
Advertisement
Advertisement
The island’s seasonal appeal generally strengthens during the drier months, broadly from May to October. July and August often attract holidaymakers seeking beach days, outdoor dining, surfing and excursions across the island. However, school holidays in Australia and other source markets can reinforce demand, meaning that favourable weather is only one part of the pricing equation.
Accommodation figures offer another important signal. Statistics Indonesia reported that Bali’s star-rated hotel occupancy reached 61.16% in May 2026, 64.87% in June and 67.29% in July. The July figure was more than six percentage points above May’s level, showing how demand can strengthen as the island enters its core dry-season travel window. These figures describe 2026 occupancy, not a complete annual comparison or proof that weather alone drove the increase.
Advertisement
Advertisement
| Bali indicator | Latest verified figure | What it means |
|---|---|---|
| Direct foreign arrivals, 2025 | 6,948,754 | International demand grew 9.72% year on year |
| Australian share of arrivals, 2025 | 23.44% | One source market supplied nearly one-quarter of foreign visitors |
| Star-rated hotel occupancy, May 2026 | 61.16% | Demand strengthened towards the dry-season peak |
| Star-rated hotel occupancy, July 2026 | 67.29% | Higher room utilisation may reduce availability in popular areas |
For travellers, the practical choice is between paying for a more predictable outdoor holiday and accepting greater flexibility during wetter months. November to April generally brings more rain, but it does not mean uninterrupted rainfall or unsuitable conditions every day. Visitors can often combine cultural attractions, restaurants, wellness experiences and shorter outdoor excursions around local forecasts.
The key is to distinguish a quieter booking period from a guaranteed bargain. Travellers should compare actual hotel rates, cancellation terms and transport costs before assuming that a rainy-season stay offers better value.
Phuket’s Monsoon Creates a Different Value Equation
Phuket faces a sharper rainfall contrast between its drier winter period and the southwest-monsoon months. Long-term climate normals for Phuket Town show average rainfall of approximately 24mm in February, rising to 350.4mm in September. October is also exceptionally wet, averaging around 336mm. These figures describe 1991–2020 climate conditions rather than any particular year’s forecast.
That difference matters because Phuket’s holiday economy depends on more than hotel rooms. Boat excursions, island-hopping tours, snorkelling trips and beach activities all depend on sea conditions, operator decisions and local safety warnings. Rainfall totals cannot establish whether a particular day will be suitable for a marine excursion, but they help travellers understand the seasonal background.
The accommodation market also shows why lower demand does not automatically translate into a uniform price collapse. CBRE’s Phuket market review reported that full-year 2025 hotel average daily rates fell 1.5% year on year, while occupancy declined by 3.3 percentage points. These are market-level changes, not evidence that every hotel became cheaper or that monsoon weather caused the decline.
| Phuket planning factor | Drier season | Wetter season |
|---|---|---|
| Typical months | December–March | May–October |
| Rainfall signal | February averages about 24mm | September averages about 350.4mm |
| Holiday priorities | Beach time, island excursions, outdoor dining | Flexible itineraries, spas, food and cultural experiences |
| Main uncertainty | Peak-season pricing and crowding | Sea conditions, heavy rain and possible excursion cancellations |
Travellers considering May to October should look beyond the advertised room rate. A cheaper resort may offer substantial savings, but repeated cancellations of prepaid boat trips can erode the value of a short holiday. Flexible excursions, refundable bookings and accommodation with attractive on-site facilities can help reduce that exposure.
Advertisement
Advertisement
November and April also deserve individual assessment rather than automatic classification as ideal shoulder-season months. Conditions can vary within these transition periods, so travellers should check current marine advisories and cancellation policies close to departure.
Hokkaido’s Two Peaks Compete for Attention
Hokkaido offers a different seasonal proposition because winter and summer attract travellers for different reasons. Snow sports, winter festivals and snowy landscapes drive one demand cycle, while summer brings flower fields, hiking, cycling and scenic road trips. A single annual peak-season label therefore fails to describe the island’s tourism economy.
The Japan Meteorological Agency’s 1991–2020 normals illustrate the scale of the seasonal contrast in Sapporo. The city averages −3.2°C in January and 22.3°C in August, a difference of 25.5°C. Average precipitation reaches 108.4mm in January and 126.8mm in August. Yet precipitation totals alone do not measure snow quality, snow depth or the operating conditions at individual ski resorts.
Hokkaido’s official tourism reporting also highlights the uneven distribution of visitors. The prefectural government reported that international arrivals between April and December 2025 rose 18% year on year to approximately 2.02 million. However, visitors remain concentrated in central areas and particular seasons, while higher accommodation prices have weighed on some domestic travel.
This creates two distinct decisions for travellers. Winter visitors should compare resort access, snow conditions, equipment hire, lift tickets and accommodation availability. Summer visitors should focus on driving distances, flower-season timing, hiking conditions and the possibility of rain or heat affecting outdoor plans.
| Hokkaido indicator | January | August |
|---|---|---|
| Mean temperature in Sapporo | −3.2°C | 22.3°C |
| Average precipitation | 108.4mm | 126.8mm |
| Principal travel appeal | Snow landscapes and winter activities | Flowers, hiking and scenic touring |
The pricing question is particularly important for ski holidays. Travellers must calculate the total package rather than compare room rates alone, since lift passes, transfers and equipment can materially change the overall budget. In summer, rental cars, regional transport and accommodation in popular rural areas may be equally important cost factors.
Advertisement
Advertisement
Sabah’s Rainfall Varies Across the State
Sabah’s tourism economy demonstrates why a destination-wide weather label can mislead travellers. Its attractions span tropical islands, rainforest reserves, mountain landscapes and marine habitats. Conditions suitable for a coastal diving holiday may differ from those needed for trekking or wildlife viewing inland.
The state recorded 3,793,709 visitor arrivals in 2025, generating RM8.74 billion in tourism receipts, according to Bernama’s report on figures released by the state tourism minister. The result exceeded 3.5 million visitors in 2024. Domestic travellers contributed almost 2.3 million arrivals, supported by festive travel, school holidays and other domestic demand drivers.
The result illustrates the importance of demand beyond international leisure travel. School calendars, public holidays and regional connectivity can create busy periods even when weather is not at its most favourable. December’s holiday demand, for example, should not be interpreted as proof that every part of Sabah enjoys identical conditions that month.
| Sabah travel interest | What travellers should assess |
|---|---|
| Island and diving trips | Local marine forecasts, sea state and operator schedules |
| Mount Kinabalu trekking | Official access requirements, trail conditions and weather advisories |
| Rainforest and wildlife experiences | Regional rainfall, trail access and activity-specific guidance |
| Coastal resort stays | Local weather patterns, room availability and school-holiday demand |
The state’s meteorological conditions vary by region, so travellers should plan around the precise area and activity rather than relying on one statewide seasonal summary. A multi-stop itinerary may need different contingency arrangements for coastal transfers, mountain access and inland excursions.
For the industry, Sabah’s growth also raises questions about how visitor spending translates into local benefits. Higher arrivals and receipts are useful indicators, but they do not reveal how evenly revenue reaches communities, accommodation providers and smaller tour operators. Future comparisons should examine visitor nights, average spending and regional distribution alongside headline arrival totals.
Why Hotel Prices Need More Than One Benchmark
Comparing accommodation costs across these destinations requires consistent measures. Average daily rate (ADR), occupancy and revenue per available room (RevPAR) describe different aspects of hotel performance. An increase in ADR does not necessarily mean hotels are earning more overall if occupancy falls at the same time.
Advertisement
Advertisement
Phuket illustrates this distinction. Its hotel market recorded a 1.5% annual decline in ADR during 2025, alongside a 3.3-percentage-point reduction in occupancy. In the first half of 2026, however, CBRE reported a modest 0.9% annual increase in ADR, while occupancy slipped by 0.8 percentage points. These figures show why hotel performance should be assessed across multiple periods rather than inferred from a single seasonal snapshot.
Bali’s official occupancy statistics provide a useful demand indicator, but they do not reveal average room prices. Hokkaido’s tourism statistics likewise document visitor trends, while Sabah’s arrival figures measure tourism volume rather than accommodation expenditure. A reliable four-way price ranking therefore requires comparable monthly hotel-rate data, ideally covering similar accommodation categories.
| Measure | What It Reveals | What It Cannot Prove Alone |
|---|---|---|
| Average daily rate | Average revenue per occupied room | Whether overall hotel revenue increased |
| Occupancy rate | Proportion of available rooms occupied | Whether rooms were sold at high prices |
| RevPAR | Room revenue relative to available capacity | Whether weather caused a change |
| Visitor arrivals | Volume of recorded visits | Average spending or length of stay |
For travellers, the most useful comparison is the total cost of the intended holiday. Resort rates, flights, transfers, excursions and cancellation conditions should be assessed together. A low room price may be attractive, but a higher-priced stay can offer better value when it protects access to the activities that matter most.
Weather Disruptions Need Evidence, Not Assumptions
Extreme-weather risks belong in the comparison, but the article must distinguish seasonal exposure from confirmed travel disruption. Heavy rainfall can affect roads, trails and marine excursions; blizzards can interrupt rail and air services; rough seas can force operators to cancel boat trips. However, a climate normal does not establish that a specific event will occur during a planned holiday.
Sabah’s meteorological guidance highlights particularly important regional differences. The northeast coast experiences a rainfall maximum around January and a relative minimum in April. Northwestern coastal areas can have two rainfall peaks, while southern Sabah generally experiences more evenly distributed rainfall, with February to April relatively drier. These differences make a single statewide seasonal recommendation inadequate.
Hokkaido presents a different risk profile. Heavy snowfall and blizzards can affect transport during winter, while rainfall can influence summer hiking and road trips. Travellers should check the Japan Meteorological Agency’s forecasts and official railway service updates before moving between regions. In Phuket, marine forecasts and local beach warnings are particularly important during the monsoon months. Bali visitors should monitor official weather and local transport notices when planning outdoor excursions.
Advertisement
Advertisement
Climate change requires a separate evidence test. Long-term climate records can establish changing temperature or rainfall patterns, while event-attribution studies assess whether human-caused warming influenced a particular extreme event. Without suitable attribution evidence, the story should describe the documented weather event and its travel consequences without claiming that climate change caused it.
A Better Calendar for Travellers and Operators
The four destinations demonstrate why travellers should choose dates around the experience they want, rather than rely on a universal ranking of the best months. Bali’s drier period can favour outdoor activities, while Phuket’s wetter season may suit flexible travellers seeking accommodation savings. Hokkaido requires separate planning for snow sports and summer landscapes, and Sabah demands regional decisions based on marine, rainforest or mountain itineraries.
For tour operators, the same evidence offers a way to manage seasonal inventory and set realistic expectations. Historical arrival patterns can guide staffing and booking strategies, while climate normals help operators explain typical conditions. Neither dataset can replace current forecasts, confirmed availability or activity-specific safety advice.
Asian holiday planning becomes more effective when travellers treat seasonality as a balance of cost, conditions and flexibility. The most useful destination is not necessarily the driest or cheapest. It is the one whose seasonal conditions best support the intended holiday, at a price the traveller can justify, with practical alternatives if the weather changes.
Advertisement
