

New York Joins California and All Other States as the US Remains the Only Major Country in the World Losing International Visitors Throughout 2026

Published
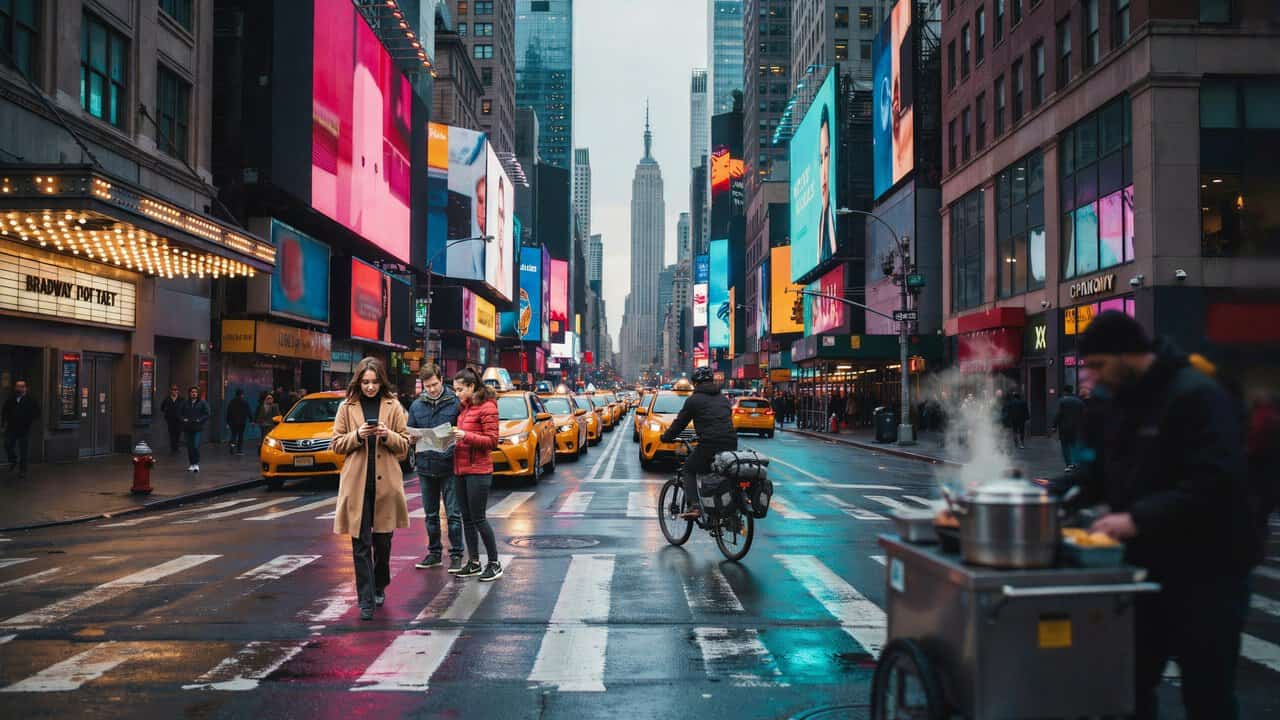
New York, California, Virginia and Washington DC have recorded lower travel volumes in the January–August 2026 figures supplied for their respective markets, adding to concerns about the performance of the United States tourism industry. The declines come as the U.S. Travel Association warns that the country is losing international visitors while competing destinations continue to attract overseas travellers.
The four destinations recorded a combined 100.54 million movements during January–August 2026, compared with approximately 102.24 million in the corresponding period of 2025, based on the rounded figures provided. California accounted for the largest volume, while Virginia experienced the greatest percentage reduction among the four.
Advertisement
Advertisement
The national picture is more complicated. The U.S. Travel Association reported that overseas visitor arrivals fell 11.8% in August and were 5.8% lower during the first eight months of 2026. Total air passenger traffic also declined by 4.4% in August, following a 2.1% reduction in July.
The figures have raised concerns about the country’s ability to attract international visitors despite hosting the 2026 FIFA World Cup. Airlines, hotels, restaurants and destination marketing organisations are monitoring whether weaker overseas demand will continue into the autumn and winter travel seasons.
Advertisement
Advertisement
US Travel Association Warns of Declining International Tourism Despite Global Travel Recovery
U.S. Travel Association President and CEO Geoff Freeman has expressed concern about the country’s international visitor performance. Speaking in September, he described the United States as the only major destination losing visitation, contrasting its position with the growth recorded in other global markets.
Freeman’s assessment reflects the industry’s concern over international competitiveness. It is an industry characterisation rather than a conclusion established by a comprehensive comparison of every major destination.
Advertisement
Advertisement
The United States welcomed approximately 68.3 million international visitors in 2025, down 5.5% from the previous year and below the approximately 79 million recorded in 2019.
U.S. Travel’s spring forecast projected a recovery to 70.6 million visitors in 2026. However, subsequent monthly data have highlighted continuing weakness in overseas arrivals, raising questions about the pace of that recovery.
The distinction between total international visitors and overseas visitors is important. Overall arrivals include Canada and Mexico, whose travel patterns can differ substantially from those of long-haul visitors arriving from Europe, Asia and South America.
New York, California, Virginia and Washington DC Record Lower Volumes in 2026
| Destination | Jan–Aug 2025 | Jan–Aug 2026 | Change in volume | YoY change |
|---|---|---|---|---|
| New York | 22.1 million | 21.5 million | −600,000 | −2.71% |
| California | 62.2 million | 61.4 million | −800,000 | −1.29% |
| Virginia | 3.443 million | 3.340 million | −103,000 | −2.99% |
| Washington DC | 14.5 million | 14.3 million | −200,000 | −1.38% |
| Combined | 102.243 million | 100.540 million | −1.703 million | −1.67% |
Source: Supplied 2025 and fiscal-year 2026 monthly screenshots, with January–August totals calculated from the displayed rounded monthly figures. These figures have not been independently identified as international tourist arrivals. They should not be combined with national international visitor totals or treated as a direct measure of the national tourism decline.
New York Tourism Faces Early-Year Declines as Visitor Volumes Stabilise During Summer
New York recorded 21.5 million movements between January and August 2026, compared with 22.1 million during the same months of 2025, representing a decline of approximately 2.71%. The sharpest decreases came early in the year, with January falling 12.5%, February declining 10% and March dropping 8.33%. These figures indicate that the weakest comparisons occurred before the principal summer tourism season.
New York Monthly Travel Figures, January–August 2026
| Month | 2025 volume | 2026 volume | YoY change |
|---|---|---|---|
| January | 2.4M | 2.1M | −12.50% |
| February | 2.0M | 1.8M | −10.00% |
| March | 2.4M | 2.2M | −8.33% |
| April | 2.5M | 2.5M | 0.00% |
| May | 2.6M | 2.7M | +3.85% |
| June | 2.9M | 2.9M | 0.00% |
| July | 3.5M | 3.5M | 0.00% |
| August | 3.8M | 3.8M | 0.00% |
| Total | 22.1M | 21.5M | −2.71% |
New York’s performance improved during the spring. May recorded a 3.85% increase, while June, July and August remained level with the previous year at the displayed precision. August was the busiest month, with 3.8 million movements, suggesting that the weakness observed in the winter did not continue at the same rate through summer.
Advertisement
Advertisement
The city remains a major gateway for international visitors seeking cultural attractions, shopping, theatre, business meetings and major events. Broadway, Times Square, Central Park and Manhattan’s hotel districts depend on demand from both American and overseas travellers. However, the supplied monthly figures do not separate these groups, making it impossible to quantify the international contribution to New York’s decline.
For the remainder of 2026, international flight demand, hotel bookings and visitor spending will be important measures of recovery. Strong summer volumes may support tourism businesses, but the early-year shortfall remains significant. New York will also need to compete with European and Asian destinations for travellers making expensive long-haul holiday decisions.
California Tourism Records 800,000 Fewer Movements as International Air Arrivals Fall
California recorded approximately 61.4 million movements during January–August 2026, compared with 62.2 million in 2025, a reduction of 1.29%. Although this was the smallest percentage decline among the four destinations, California experienced the largest absolute decrease. August recorded the weakest annual comparison, falling 3.66%, while July declined 2.41% despite remaining the busiest month.
California Monthly Travel Figures, January–August 2026
| Month | 2025 volume | 2026 volume | YoY change |
|---|---|---|---|
| January | 7.9M | 7.8M | −1.27% |
| February | 6.8M | 6.8M | 0.00% |
| March | 7.7M | 7.8M | +1.30% |
| April | 7.8M | 7.6M | −2.56% |
| May | 7.8M | 7.8M | 0.00% |
| June | 7.7M | 7.6M | −1.30% |
| July | 8.3M | 8.1M | −2.41% |
| August | 8.2M | 7.9M | −3.66% |
| Total | 62.2M | 61.4M | −1.29% |
California’s international tourism data provides more direct evidence of weakening overseas demand. Visit California reported 650,900 non-resident international air arrivals in August 2026, a decline of 6.4% from August 2025. Arrivals from its 13 priority international markets fell 6.7%.
France recorded a 26.5% decline, Germany fell 20%, and India dropped 16.5%. However, Canada increased 3% and Mexico grew 7.4%, demonstrating that not every international market followed the same pattern.
These changes matter for Los Angeles, San Francisco, San Diego and California’s wider visitor economy. International travellers contribute to hotels, restaurants, car rentals, attractions and retail spending. A sustained reduction in long-haul arrivals could weaken demand in businesses that depend heavily on overseas customers.
Advertisement
Advertisement
California’s outlook will depend on air connectivity, pricing and the performance of individual source markets. Growth from Canada and Mexico may partially offset weaker European and Asian arrivals, but it cannot be assumed that visitors from different countries contribute the same spending or length of stay.
Virginia Tourism Faces a 2.99% Decline as Spring Travel Records Its Weakest Performance
Virginia recorded approximately 3.34 million movements between January and August 2026, compared with 3.443 million a year earlier. The decline of 2.99% was the largest percentage reduction among the four destinations examined. April recorded the sharpest fall at 7.75%, followed by May at 5.19% and June at 4.21%, indicating that the spring and early summer periods were particularly weak.
Virginia Monthly Travel Figures, January–August 2026
| Month | 2025 volume | 2026 volume | YoY change |
|---|---|---|---|
| January | 378K | 377K | −0.26% |
| February | 272K | 278K | +2.21% |
| March | 363K | 358K | −1.38% |
| April | 426K | 393K | −7.75% |
| May | 443K | 420K | −5.19% |
| June | 475K | 455K | −4.21% |
| July | 540K | 525K | −2.78% |
| August | 546K | 534K | −2.20% |
| Total | 3.443M | 3.340M | −2.99% |
Virginia’s tourism economy includes historic destinations such as Colonial Williamsburg, natural attractions including Shenandoah National Park, coastal holidays in Virginia Beach and business activity around Northern Virginia. These markets have different visitor profiles, so a statewide decline cannot automatically be attributed to a reduction in foreign tourists.
The figures show some improvement after April. Although May through August remained below their 2025 equivalents, the rate of decline moderated towards the end of summer. August recorded 534,000 movements, the state’s highest monthly volume in the eight-month period, despite remaining 2.2% below August 2025.
Virginia’s recovery will depend on domestic travel demand alongside international connectivity. The state also benefits from proximity to Washington DC and the broader capital region. Further analysis of hotel occupancy, visitor origin and spending would help determine whether the recorded decline reflects reduced leisure travel, business activity or another movement category.
Washington DC Tourism Stabilises After Winter Declines as August Records 4.76% Growth
Washington DC recorded approximately 14.3 million movements during the first eight months of 2026, compared with 14.5 million in 2025, representing a 1.38% decline. The capital experienced its largest reductions between January and March, when monthly year-on-year changes ranged from minus 5.56% to minus 6.67%. However, the figures subsequently stabilised, with August delivering the strongest annual growth.
Advertisement
Advertisement
Washington DC Monthly Travel Figures, January–August 2026
| Month | 2025 volume | 2026 volume | YoY change |
|---|---|---|---|
| January | 1.6M | 1.5M | −6.25% |
| February | 1.5M | 1.4M | −6.67% |
| March | 1.8M | 1.7M | −5.56% |
| April | 1.7M | 1.7M | 0.00% |
| May | 1.7M | 1.7M | 0.00% |
| June | 1.9M | 1.9M | 0.00% |
| July | 2.2M | 2.2M | 0.00% |
| August | 2.1M | 2.2M | +4.76% |
| Total | 14.5M | 14.3M | −1.38% |
The recovery during August stands out because Washington DC was the only destination among the four to record a clearly positive annual comparison that month. This followed several months of stable figures at the precision provided, suggesting that the early-year weakness had eased.
Washington DC attracts visitors for government business, conferences, educational trips, museums and national landmarks. The Smithsonian museums, National Mall and historic monuments form part of its established tourism offer. International visitors are important to the capital’s hospitality industry, but the supplied figures do not establish how much of the August improvement came from overseas travellers.
Business travel and autumn conferences could provide additional demand during the final quarter of 2026. The broader Washington metropolitan region also benefits from major international airports and connections to Northern Virginia, although future visitor growth will depend on travel costs, meeting demand and international arrivals.
Why the United States Is Losing International Visitors Despite Hosting the FIFA World Cup
The United States entered 2026 with expectations that the FIFA World Cup would encourage additional international travel. However, the available national statistics indicate that major events have not fully reversed the decline in overseas arrivals.
According to the National Travel and Tourism Office, overseas visitor arrivals fell 7% in July 2026 compared with July 2025. Total international arrivals, which also include Canada and Mexico, declined by only 0.1% that month because arrivals from the two neighbouring countries increased.
Several factors may influence international demand. These include travel costs, currency movements, airline capacity, visa processing times and visitors’ perceptions of the entry process. The U.S. Travel Association has also raised concerns about the country’s international competitiveness.
Advertisement
Advertisement
However, the four state and district datasets cannot establish why overseas arrivals are falling nationally. Their measures may include domestic passengers or other movements, and their combined figures should not be interpreted as a direct share of international tourism.
US Travel Industry Targets 100 Million International Visitors by 2030
On 2 September 2026, leading travel industry executives met President Donald Trump at the White House to discuss strengthening international tourism.
Following the meeting, the U.S. Travel Association announced an industry ambition of attracting 100 million international visitors annually by 2030. The discussions addressed barriers facing overseas travellers, including visa processing, international perceptions and airport efficiency.
The target is more ambitious than the National Travel and Tourism Office’s official forecast, which projects approximately 85.2 million international visitors in 2030, compared with 68.3 million in 2025.
Achieving the industry’s higher target would require substantial growth in inbound travel over the next four years. The result will depend on demand from established overseas markets, improved travel access and the ability of destinations to convert visitors into longer stays and greater expenditure.
US Tourism Decline in 2026 Reveals Different Challenges Across Major Destinations
| Destination | January–August change | Most difficult month | Strongest month by annual change | Main tourism consideration |
|---|---|---|---|---|
| New York | −2.71% | January, −12.50% | May, +3.85% | Recovering winter demand and maintaining international city tourism |
| California | −1.29% | August, −3.66% | March, +1.30% | Rebuilding overseas air arrivals, particularly from European markets |
| Virginia | −2.99% | April, −7.75% | February, +2.21% | Understanding spring weakness and sustaining summer tourism |
| Washington DC | −1.38% | February, −6.67% | August, +4.76% | Maintaining the summer improvement and attracting business travellers |
The comparison shows that declining eight-month totals do not necessarily mean visitor activity weakened continuously throughout the year. New York stabilised during summer, Washington DC recovered in August, California experienced renewed weakness late in the period, and Virginia recorded a gradual moderation in its annual declines.
Advertisement
Advertisement
Tourism Outlook for the Rest of 2026
The United States faces a challenge in converting its extensive tourism infrastructure and major international events into sustained inbound visitor growth.
U.S. Travel’s August dashboard offered some encouraging signs. Corporate hotel bookings for October were running 5.2% ahead of the previous year as of mid-September, with November up 7.7% and December ahead 11.2%.
However, forward hotel bookings are not the same as confirmed international arrivals. They include broader corporate travel demand and cannot guarantee an overseas tourism recovery.
New York joins California and other states in facing weaker travel as the US remains, according to industry leaders, the only major country in the world losing international visitors in 2026, amid high costs, visa barriers and travel concerns.
Conclusion
New York, California, Virginia and Washington DC recorded lower January–August volumes in the supplied 2026 data, while national statistics indicate declining overseas arrivals. The U.S. Travel Association is seeking stronger international tourism growth through improved access and a 100-million-visitor target for 2030. Recovery will depend on air connectivity, affordability, visitor confidence and sustained overseas demand.
Advertisement
