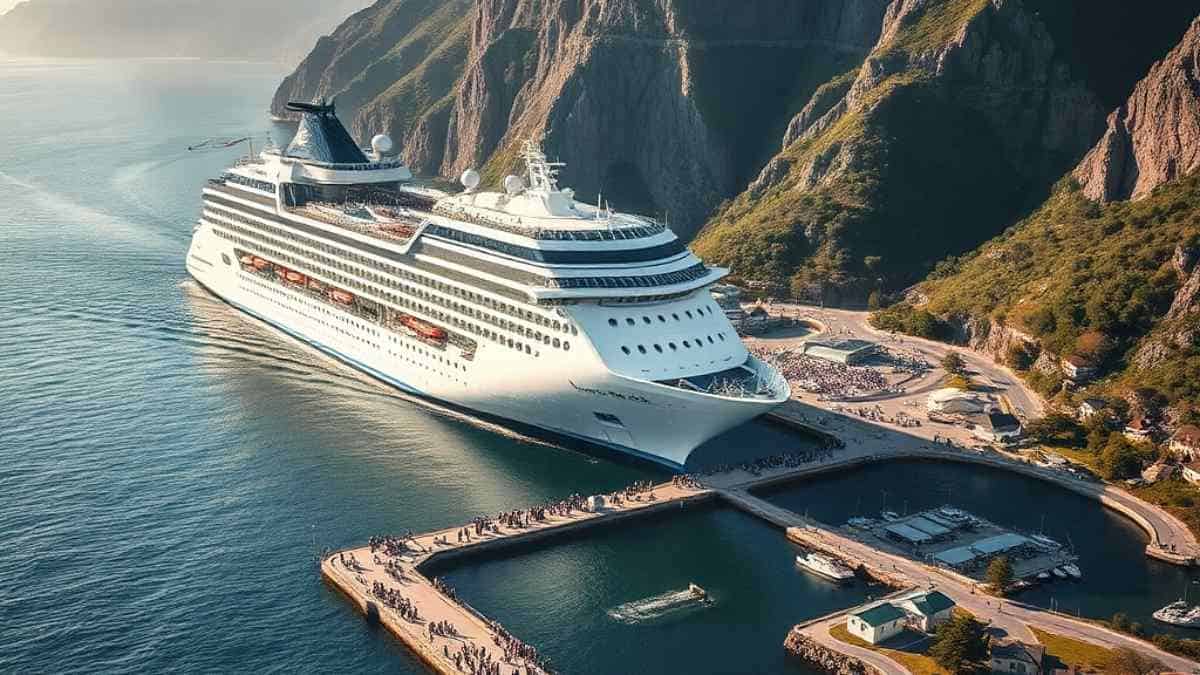
Image generated with Ai
New Zealand, along with many other nations, is now entering into a new era of cruise tourism development, where rising passenger numbers are posing new problems for destination regions. With large cruise ships visiting smaller ports with hundreds of tourists, there are additional pressures placed upon local transport services, attractions, and public services. Nations such as Japan, Saudi Arabia, and Norway have now shifted towards developing more intelligent infrastructures in order to avoid overcrowding while maximizing economic opportunities for local communities. The problem now is not just one of attracting cruise tourists, but of managing their arrival and distribution.
National tourism strategies around the world are undergoing a structural shift as economic planners look to maximize the monetary contribution of international travel. For decades, destination management organisations and government ministries relied on volume metrics—such as overseas visitor arrivals, ship call totals, and passenger berth tallies—to measure the health of the sector. However, as countries establish bold economic blueprints to double the export value of international travel over the next decade, this reliance on volume metrics reveals significant operational vulnerabilities. The central challenge facing regional economies is no longer getting cruise ships to dock at coastal gateways, but capturing land-side financial value without overwhelming local infrastructure, environment, and host communities.
Advertisement
This tension between volume goals and physical capacity is particularly evident in the cruise industry. To maximize efficiency, cruise lines build and deploy larger vessels, disembarking thousands of passengers at secondary regional ports during narrow six-to-eight-hour visits. When this rapid arrival of visitors hits a small community, local transport networks, historic sites, and public utilities experience immediate operational stress. If regional transport and excursion networks cannot handle these sudden crowds, passenger spending remains trapped within immediate port precincts, leading to significant revenue dilution for the wider region.The Dual Infrastructure Bottleneck Key Capacity Challenges Maritime Gateway Capacity Regional Land-Side Capacity Deep-water quay berths for cruise ship arrivals Limited tour coach fleet availability High-capacity tender docks for passenger transfers Shortage of certified bilingual tour guides Shore power (Cold Ironing) facilities to support sustainable vessel operations Limited heritage rail asset capacity Passenger handling terminals for efficient embarkation and disembarkation Insufficient municipal infrastructure, including transport grids and visitor facilities Impact: Inadequate port-side infrastructure limits efficient cruise passenger movement and creates operational bottlenecks Impact: Weak regional transport and visitor infrastructure restricts destination access and reduces tourism benefits Regional Yield Gap Impact Details High Offshore Leakage Approximately 50%–70% of cruise passenger spending may remain outside regional destinations due to limited local service integration and external tour operations Land-Side Transport Deficits Insufficient coaches, guides, heritage transport and visitor facilities create congestion and reduce passenger movement efficiency Economic Outcome Lower direct local passenger spending, estimated at around $70–$150 per day, combined with increased pressure on regional tourism sites Strategic Challenge Investment in both maritime gateways and regional land-side infrastructure is required to convert cruise arrivals into sustainable local economic growth
The friction between national growth goals and local ground capacity stems from an imbalance in capital investment. Millions of dollars are spent upgrading deep-water quays, dredging channels, and expanding cruise terminals to accommodate large vessels, while land-side infrastructure in surrounding regions often receives minimal support. Disembarking thousands of passengers into small towns lacking regional transport networks creates severe congestion, straining local roads, parking facilities, public restrooms, and nature trails.
Advertisement
This operational strain creates a distinct economic paradox: local councils and taxpayers fund public amenities, road maintenance, and waste management for high-density visitor arrivals, while local businesses capture only a small fraction of overall passenger spending. Most passenger spend is collected offshore through pre-booked packages, leaving local economies to handle the physical congestion without retaining proportional financial returns. Bridging regional tourism yield gaps requires establishing integrated planning frameworks that align maritime disembarkation schedules directly with regional transport capabilities and heritage site limits.
Achieving national tourism targets without doubling physical overcrowding requires shifting focus from raw passenger volume to maximizing spend-per-visitor-hour. Simply increasing berth capacity or ship call frequency does not automatically generate regional economic growth. Instead, destination management organisations must calculate and optimize the total land-side economic yield retained by local businesses per disembarkation hour.
To model this dynamic, economic planners evaluate the interaction between direct passenger spend, offshore financial leakage, vessel port duration, and local infrastructure constraints. When local transport bottlenecks limit passenger movement, spending stays low regardless of ship size. Conversely, when regional destinations offer well-organized inland excursions, high-end cultural experiences, and seamless heritage transit links, local spend per visitor hour increases substantially.
To evaluate how these dynamics operate in real-world settings, four key maritime nations with ambitious tourism targets provide clear empirical evidence of land-side capacity challenges.Nation Target Horizon & Strategic Goal Primary Cruise Growth Focus Core Regional Land-Side Bottleneck New Zealand Target 2034: Double export value to $19.8B NZD Secondary ports (Tauranga, Napier, Dunedin) Severe tour coach shortages & heritage rail caps Japan Vision 2030: 60M visitors & 15T JPY spend Secondary regional calls (Kanazawa, Ishigaki, Kochi) Guide interpreter shortages & driver hour limits Saudi Arabia Vision 2030: 150M visitors & 10% GDP share Red Sea and Arabian Gulf cruise expansion Rapid capital demand for desert transit to sites like AlUla Norway 2026/2032 Mandate: Net-zero UNESCO fjord travel Fjord calls (Geiranger, Flåm, Aurlandsfjord) Grid capacity for shore power & narrow road bottlenecks
New Zealand’s Ministry of Business, Innovation and Employment established a strategic economic framework under the Tourism Growth Roadmap, aiming to double international tourism export value from $9.9 billion NZD in 2023 to $19.8 billion NZD by 2034. This policy framework targets an increase in annual international visitor arrivals to 3.89 million by 2026, reaching approximately 4.78 million by 2034. While international travel across the country has steadily recovered—reaching 3.51 million overseas visitor arrivals in the year ending December 2025—the cruise sector faces significant land-side operational constraints.New Zealand Tourism Roadmap (Target 2034) 2023 Baseline Target Horizon 2034 International Export Spend NZ$9.9 billion NZ$19.8 billion Overseas Visitor Arrivals 2.96 million visitors Approximately 4.78 million visitors Tourism Contribution to Total Exports Around 17% More than 25% projected
In primary and secondary cruise ports across Aotearoa—including Auckland, Tauranga, Napier, and Dunedin (Port Otago)—regional deployment surges have exposed excursion supply bottlenecks. The main bottleneck is a nationwide deficit of luxury tour coaches and driver-guides. Moving 4,000 disembarking passengers on high-value inland excursions—such as geothermal tours from Tauranga to Rotorua or agricultural tours from Napier—requires 80 to 90 modern 50-seater tour coaches operating simultaneously.
In regional ports like Napier or Dunedin, local coach fleets max out at 20 to 25 available vehicles, as part of the regional transport capacity was decommissioned or repurposed during previous economic downturns. As a result, thousands of disembarking passengers cannot access paid inland excursions and remain confined to low-spending walking itineraries within immediate port precincts. This creates notable passenger spend disparities, leaving high potential spend uncaptured due to ground vehicle limits.Dunedin / Port Otago Tourist Dispersal Bottleneck Challenges and Impact Mega Cruise Vessel Arrival A large cruise ship arrives at Port Otago and disembarks approximately 4,000 passengers, creating immediate demand for regional transport and attractions. Regional Capacity Constraint Around 40% capacity limitation restricts effective passenger distribution across available tourism services. Taieri Gorge Railway & Coach Fleets High-value excursion opportunity but limited by operational capacity. Limited carriage availability Premium inland excursions cannot accommodate all interested passengers. High-yield inland excursion value Generates approximately NZ$180–NZ$350 per passenger through rail journeys, guided tours and regional spending. Instant capacity saturation Popular excursions reach full capacity quickly, leaving many passengers unable to access higher-value experiences. Port Precinct Walkers Lower-value visitor activity caused by limited transport options and attraction access. Minimal local spending Passenger spending remains low, estimated at around NZ$20–NZ$50 per visitor. Street congestion pressure Large numbers of pedestrians remain concentrated around port areas, increasing pressure on local streets and facilities. Overall Tourism Challenge Limited regional dispersal infrastructure prevents cruise destinations from capturing higher visitor spending and spreading economic benefits beyond the port precinct.
A prime example of heritage transport bottlenecks is Dunedin’s historic Taieri Gorge Railway. Serving as an excursion link carrying passengers directly from Dunedin’s railway hub into the Otago hinterland, track maintenance backlog, rolling stock constraints, and municipal funding caps have restricted operational capacity. When multiple vessels berth simultaneously at Port Otago, the rail line’s limited bandwidth cannot meet demand, capping high-ticket regional dispersal.

Image generated with Ai
Japan’s national tourism strategy, set under the cabinet’s Vision 2030 blueprint, aims to welcome 60 million annual international visitors and reach 15 trillion JPY in visitor spend by 2030. Following a post-pandemic surge in port calls, the Japan Tourism Agency and the Ministry of Land, Infrastructure, Transport and Tourism prioritized dispersing cruise ship traffic away from overcrowded urban centers like Tokyo, Osaka, and Kyoto toward regional prefectures.Japan Vision 2030 Growth Strategy 2019/2023 Baseline Target Horizon 2030 International Annual Visitors 31.8 million visitors 60.0 million visitors Total Annual Tourism Consumption JPY 4.8 trillion JPY 15.0 trillion Secondary Port Regional Calls Approximately 35% of total cruise calls More than 60% target share
International cruise lines responded by expanding calls to secondary regional ports, including Kanazawa, Ishigaki, Kochi, and Sakaiminato. However, these regional prefectures face severe labor deficits driven by rural demographic decline. The primary constraint in outer prefectures is a shortage of licensed, English-speaking tour guides and commercial bus drivers.
Strict driver labor regulations—which limit daily driving hours to prevent fatigue—mean regional bus companies cannot run multi-stop rural excursions for thousands of ship passengers without deploying extra driver shifts. Combined with a shortage of nationally certified guide-interpreters (T通訳案内士) outside major metropolitan areas, regional destinations struggle to organize high-yield land tours. Consequently, cruise lines resort to basic shuttle runs to nearby commercial malls, capturing minimal local spend and increasing local resistance to port expansion.
Under its National Tourism Strategy and Vision 2030 roadmap, Saudi Arabia expanded its target to attract 150 million annual domestic and international visitors while increasing tourism’s direct GDP contribution to 10%. A core component of this strategy is establishing a cruise ecosystem along the Red Sea and Arabian Gulf, managed by Cruise Saudi.Saudi Arabia Vision 2030 Strategy Historical Target Revised Target 2030 Annual Total Visitor Volume 100 million visitors 150 million visitors Tourism Sector GDP Contribution Approximately 3% baseline 10.0% Key Maritime Port Hubs Jeddah / Yanbu Jeddah, Yanbu, Dammam
Cruise Saudi invested heavily in maritime infrastructure, building passenger terminals at Jeddah Islamic Port, Yanbu Commercial Port, and King Abdulaziz Port in Dammam. However, the rapid pace of port development created an operational mismatch with land-side readiness in nearby heritage regions.
For instance, when cruise ships call at Yanbu or Jeddah, passengers seek shore excursions to inland heritage destinations like the UNESCO World Heritage site at AlUla or the historic district of Al-Balad. Moving thousands of passengers from coastal ports across long desert corridors requires specialized luxury coaches, high-speed rail links, and high-end desert excursion vehicles. Building vehicle fleets, training multi-lingual heritage guides, and constructing hospitality facilities capable of handling large passenger surges require ongoing capital investments to prevent land-side logistics bottlenecks.
Norway’s approach to maritime tourism prioritizes environmental regulation and site preservation over volume expansion. The Norwegian Parliament (Storting) enacted strict zero-emission mandates for vessels operating within Norway’s World Heritage fjords—specifically Geirangerfjord, Nærøyfjord, Aurlandsfjord, Sunnylvsfjord, and Tafjord. The regulations enforce zero-emission requirements for tourist ships and ferries under 10,000 gross tonnage starting January 1, 2026, with larger cruise ships required to comply by January 1, 2032.Norway World Heritage Fjord Decarbonisation Regulated Vessel Category Mandate Requirement 1 January 2026 Vessels below 10,000 Gross Tonnage Zero direct carbon emissions 1 January 2032 Vessels 10,000 Gross Tonnage and above Zero direct carbon emissions Key Locations Flåm, Geiranger, Nærøyfjord Mandatory shore power and biogas adoption
These environmental mandates intersect with physical carrying capacity limits in narrow fjord villages such as Geiranger and Flåm. In Geiranger, a community with fewer than 300 permanent residents, the arrival of a single 4,000-passenger vessel increases the local population tenfold within two hours. The local road network consists of steep, single-lane mountain passes vulnerable to rockfalls and severe traffic delays.
To meet zero-emission targets, tour operators must transition from diesel buses to battery-electric coach fleets. However, charging these electric vehicles requires substantial electrical grid upgrades in remote valleys. Additionally, providing high-voltage shore power in ports like Flåm requires significant state and regional grid investments. Without adequate electrical grid capacity, ports cannot charge docked ships or power electric transport fleets, leading to vessel caps, canceled calls, and local economic disruption.
Evaluating regional tourism yield gaps requires analyzing key quantitative metrics that govern land-side tourism operations.
A critical distinction in cruise economics exists between transit passengers and turnaround (homeport) passengers. Data across international cruise ports shows a clear spend gap between these two groups.Passenger Category Average Onshore Spend Primary Spend Allocation Economic Leakage Rate Local Retention Rate Transit Passenger $70 USD – $150 USD / day Excursions, souvenirs, light F&B 50% – 70% (High leakage) 30% – 50% retained locally Turnaround Passenger $350 USD – $600 USD / stay Hotels, fine dining, flights, taxis 15% – 30% (Low leakage) 70% – 85% retained locally
Transit passengers spend between $70 and $150 USD per day onshore, largely focused on pre-booked shore excursions, souvenirs, and incidental food purchases. Turnaround passengers generate between $350 and $600 USD per stay, directly benefiting local hotels, dining establishments, and airport transport networks.
A major factor depressing transit passenger impact is the excursion yield leakage factor. When passengers book shore excursions directly through international cruise portals, 50% to 70% of the gross ticket price leaks back to cruise lines and global booking intermediaries as commissions. The remaining 30% to 50% paid to local ground operators must cover vehicle leases, fuel, insurance, and labor costs, leaving minimal profit retention for local host communities.Shore Excursion Yield Leakage Breakdown Estimated Share Economic Flow and Impact Gross Excursion Ticket Price Paid by Passenger US$200 per passenger Total value generated from a cruise shore excursion purchase before revenue distribution. Cruise Line & Global Aggregators 50%–70% Leakage A significant portion of excursion revenue leaves the destination through offshore booking commissions, retained corporate margins and external financial clearing systems. Offshore Booking Commissions Part of leakage share Revenue retained by international distribution platforms and cruise operators for selling and managing excursions. Corporate Margins Part of leakage share Cruise companies and global operators retain earnings before money reaches local suppliers. External Financial Clearing Part of leakage share Payments processed outside the destination reduce direct regional economic circulation. Local Regional Economy 30%–50% Retained Remaining excursion revenue supports local tourism businesses and service providers. Local Tour Coach Operations Part of retained share Supports transport companies operating regional sightseeing transfers. Driver and Local Guide Wages Part of retained share Creates employment income for local workers and tourism professionals. Food, Fuel and Site Entry Fees Part of retained share Generates spending for local suppliers, attractions and community businesses.
| Destination Port | Available Regional Tour Coaches | Vessel Passenger Capacity | Required Coaches (50% Excursion Rate) | Immediate Regional Coach Deficit |
| Tauranga (New Zealand) | 35 Coaches | 4,000 Passengers | 64 Coaches | -29 Coaches (-45%) |
| Kanazawa (Japan) | 40 Coaches | 3,800 Passengers | 61 Coaches | -21 Coaches (-34%) |
| Yanbu (Saudi Arabia) | 25 Coaches | 3,200 Passengers | 51 Coaches | -26 Coaches (-51%) |
| Geiranger (Norway) | 12 Electric Coaches | 4,200 Passengers | 67 Coaches | -55 Coaches (-82%) |
This transport deficit forces thousands of visitors to remain within walking distance of the port terminal, creating localized street congestion while missing opportunities for higher-yield regional dispersal.
Land-side capacity is further constrained by major infrastructure capital deficits at secondary ports, particularly regarding shore power systems (cold ironing technology).Infrastructure Component Cost Range / Technical Requirement Operational & Economic Impact Shore Power Installation £6.6M – €37M+ ($8M – $40M USD per berth) Eliminates berthed ship emissions; reduces noise pollution Annual O&M Expenses ~5% of initial capital investment Ongoing financial demand on port authorities Grid Substation Headroom 10 MVA – 20 MVA dedicated capacity Requires major local electrical grid upgrades Frequency Converters Static conversion (50 Hz to 60 Hz) Necessary for international vessel compatibility
Installing cold ironing systems requires between $8 million and $40 million USD per berth, depending on local grid proximity and switchgear needs. Ships require high-voltage connections (typically 6.6 kV or 11 kV) at either 50 Hz or 60 Hz frequencies, necessitating static frequency converters and sub-stations.
For small municipal port authorities, funding these capital investments without central government support is difficult, as annual maintenance averages 5% of initial capital costs. However, failure to provide shore power risks regulatory penalties, ship re-routings, or public resistance in coastal communities.The “3-Hour Crush” Congestion Curve Time Period Tourism Pressure Level Key Impacts Early Arrival Phase 07:00 AM – 10:00 AM Increasing visitor activity Cruise passengers begin arriving, creating gradual pressure on transport networks, attractions and local facilities. Peak Crush Period 10:00 AM – 1:00 PM Highest congestion level (around 75%–100% capacity pressure) Site overcrowding, displacement of stayover visitors, transport exhaustion and heavy pressure on destination infrastructure. Recovery Phase 1:00 PM – 5:00 PM Declining visitor intensity Cruise passengers begin departing, reducing congestion and allowing destinations to gradually recover. Low Pressure Period After 5:00 PM Normal destination activity Visitor numbers return closer to regular levels, improving access and local experience quality. Peak Crush Impact Area Description Site Overcrowding High concentration of visitors creates pressure on attractions, walking routes and natural environments. Stayover Displacement Overnight visitors may experience reduced access, longer waiting times and lower-quality experiences. Transport Exhaustion Local buses, coaches and road networks operate at maximum capacity, causing delays and congestion.

Image generated with Ai
To mitigate site congestion and maximize spend retention, leading maritime destinations deploy the secondary port spoke model. Instead of over-concentrating ship calls at primary capital ports, regional networks distribute vessels across secondary ports connected to inland heritage hubs via dedicated transit corridors.Secondary Port Spoke Dispersal Model Role and Function Key Features and Benefits Primary Port (Over-congested Hub) Main cruise arrival gateway handling the majority of passenger flows Experiences capacity pressure, congestion, limited visitor movement and reduced destination yield due to passenger concentration. Secondary Port A (Dedicated Cruise Quay) Alternative cruise arrival point to redistribute passenger volumes Creates additional berthing capacity and reduces pressure on the primary port infrastructure. Secondary Port B (Marine Tender Hub) Supporting passenger transfer location for cruise operations Enables flexible vessel access and improves regional passenger distribution. Inland Heritage Spoke Connects cruise visitors with cultural and historical attractions Includes heritage rail links, local excursion vendors and high-value experiences that increase local spending retention. Heritage Rail Link Tourism transport connection to inland destinations Provides unique regional experiences while spreading visitor spending beyond port areas. Local Excursion Vendors Community-based tourism operators delivering authentic experiences Retains more visitor expenditure within regional economies and supports local businesses. High Spend Retention Model Economic strategy focused on capturing greater visitor value locally Reduces offshore leakage and increases regional tourism revenue. Inland Nature Spoke Directs visitors towards natural attractions through controlled access Uses timed electric shuttles and capped visitor trails to protect environments while managing demand. Timed Electric Shuttles Sustainable visitor transport solution Reduces congestion, lowers emissions and improves passenger movement efficiency. Capped Visitor Trails Visitor management system for sensitive natural areas Prevents overcrowding, protects ecosystems and maintains destination quality. Zero Local Leakage Objective Maximises economic benefits within the destination Ensures tourism spending remains with local operators, communities and regional suppliers.
Executing this dispersal strategy requires integrated transport infrastructure, including dedicated heritage rail lines, express coach shuttles, and timed-entry booking systems for high-visitation natural and cultural sites.
To address these challenges, national tourism ministries and regional destination management organisations should implement structured policy frameworks.Strategic Policy & Investment Matrix Action Item Target Outcome Infrastructure Funding Public-private port grants Co-fund shore power infrastructure and strengthen sustainable cruise port facilities. Berth Slot Management Staggered docking intervals Flatten the “3-hour crush” by spreading passenger arrivals and reducing peak congestion. Excursion Revenue Management Mandatory local sourcing rules Reduce offshore revenue leakage and increase local economic retention from cruise tourism. Workforce Development Guiding and driver academies Address tourism labour shortages by expanding skilled local workforce capacity. Site Management Timed reservation ticketing systems Protect natural assets, control visitor flows and maintain destination quality.
Meeting the challenging national objectives for doubling tourism contribution can be accomplished by overcoming physical and operational barriers within regional land side infrastructure facilities. As revealed from the case studies of New Zealand, Japan, Saudi Arabia, and Norway, increasing capacity of coastal berths without tackling issues with transportation, lack of guides, and carrying capacity of sites leads to congestion and economic leakage. Overcoming tourism yield gaps at the regional level will involve an emphasis on spend per visitor hour maximization, investment in complementary infrastructure, and scheduling of ports. Destination management organizations have to use localized tender concessions and supply retention mechanisms for achieving this objective.
Advertisement
Tags: cold ironing, Cruise Economics, destination management, Excursion Leakage, Regional Tourism Yield Gaps
Advertisement
Advertisement









Thursday, September 3, 2026

Thursday, September 3, 2026
Thursday, September 3, 2026
Thursday, September 3, 2026

Thursday, September 3, 2026

Wednesday, September 2, 2026

Thursday, September 3, 2026

Thursday, September 3, 2026