Las Vegas Joins San Francisco and Others as US Cities Stage Powerful Summer Tourism Rebound in 2026

Published
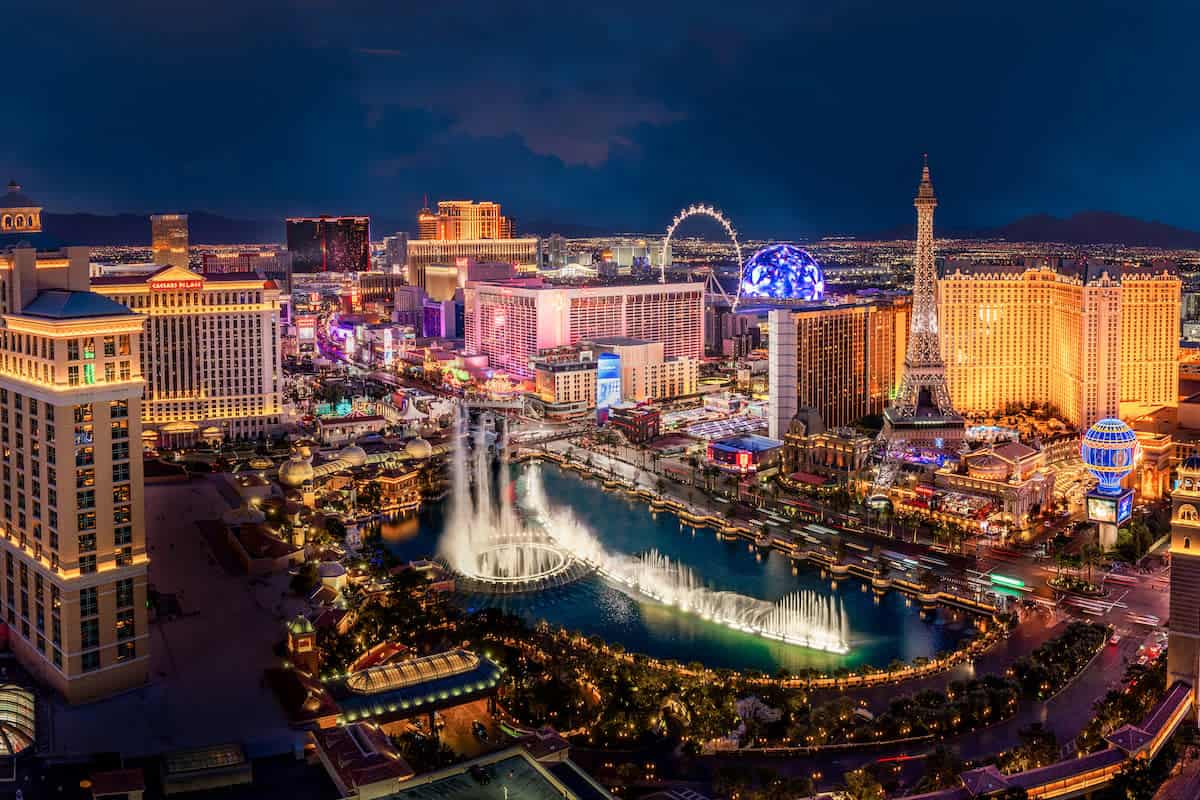
Las Vegas joined San Francisco and other major US cities in delivering a powerful summer tourism rebound in 2026, as stronger visitor demand, major events and renewed leisure travel momentum lifted hotel performance across key urban destinations. While San Francisco benefited from World Cup matches and large-scale events, Las Vegas recorded a notable recovery with visitor numbers reaching around 3.17 million in July, hotel occupancy climbing to 77.2% and RevPAR rising 3.2% to $121.55. Across the United States, cities such as New York, Miami, Dallas, Houston and Seattle also experienced event-driven growth, highlighting how major attractions, international sporting events and rising travel confidence helped transform summer 2026 into a significant tourism comeback period for US cities.
San Francisco — World Cup and Major Events Ignite a Powerful Summer Comeback
San Francisco delivered one of the strongest U.S. city tourism rebounds of summer 2026. In June, hotel occupancy reached 80.5%, up 7.9%, while the average daily rate climbed 21.7% to $264.42 and RevPAR surged 31.2% to $212.87. During June 14–20, amid World Cup matches and major business events, occupancy reached 84.8%, ADR jumped 53.5% to $301.35 and RevPAR soared 80.5% to $255.45. Momentum continued into late August, when RevPAR increased 59.9%, reinforcing San Francisco’s position as one of the standout urban tourism markets of the summer.
Advertisement
Advertisement
| San Francisco Indicator | Summer 2026 | YoY Change |
|---|---|---|
| June occupancy | 80.5% | +7.9% |
| June ADR | $264.42 | +21.7% |
| June RevPAR | $212.87 | +31.2% |
| June 14–20 RevPAR | $255.45 | +80.5% |
| Late-August RevPAR | $191.87 | +59.9% |
New York City — World Cup Final Sends Hotel Demand and Prices Soaring
New York City’s summer rebound accelerated around the FIFA World Cup final at nearby MetLife Stadium. During July 12–18, average hotel rates surged 41.5% to $425.03, while RevPAR jumped 40.3% to $377.07. The night before the final produced an even more dramatic spike, with ADR increasing 105.1% and RevPAR rising 116.1% year over year. Momentum remained strong the following week, when ADR reached $375.12, up 28.1%, and RevPAR climbed 35% to $348.62. Major-event tourism therefore provided a powerful mid-summer boost to New York’s already enormous visitor economy.
| New York City Indicator | July 2026 | YoY Change |
|---|---|---|
| ADR, July 12–18 | $425.03 | +41.5% |
| RevPAR, July 12–18 | $377.07 | +40.3% |
| ADR before World Cup final | — | +105.1% |
| RevPAR before World Cup final | — | +116.1% |
| RevPAR, following week | $348.62 | +35.0% |
Washington DC — Summer Events Push Hotel Occupancy Sharply Higher
Washington DC emerged as another summer winner as major events and seasonal travel strengthened hotel demand. During July 12–18, Washington recorded an occupancy increase of 7% year over year, taking the rate to 78.3%. The performance represented a noticeable improvement after a softer opening to 2026, when average hotel rates during January–April stood at $190.99, down 3.4%. Summer events and leisure travel therefore helped shift the capital’s accommodation market towards stronger demand. The rebound demonstrates how major national celebrations, cultural attractions and event-driven travel can rapidly strengthen hotel performance even after a relatively subdued start to the year.
Advertisement
Advertisement
| Washington DC Indicator | Result | Change |
|---|---|---|
| July 12–18 occupancy | 78.3% | +7.0% |
| Jan–Apr ADR | $190.99 | -3.4% |
Miami — World Cup Tourism Gives Hotel Pricing a Major Boost
Miami’s summer rebound was visible most clearly in hotel pricing. In June, average daily rates jumped 23.2% to $218.37, with World Cup-related demand contributing to stronger performance. Momentum continued into July. During July 12–18, Miami’s ADR climbed another 26.7% year over year to $212.74. The summer acceleration followed an already strong start to 2026, when Miami-Dade’s January–April average room rate reached $304.81, up 11.2% from $274.14 a year earlier. The figures demonstrate Miami’s ability to combine its traditional leisure and beach appeal with major-event tourism to generate substantial pricing power for hotels.
| Miami Indicator | 2026 Result | YoY Change |
|---|---|---|
| June ADR | $218.37 | +23.2% |
| July 12–18 ADR | $212.74 | +26.7% |
| Jan–Apr ADR | $304.81 | +11.2% |
Dallas — World Cup Semifinal Turns July Into a Hotel Revenue Winner
Dallas transformed major-event demand into a sharp hotel rebound during July. The city hosted a World Cup semifinal during the July 12–18 reporting week, helping average daily rates increase 21.5% to $144.41. RevPAR climbed even faster, surging 26.6% to $96.81. The improvement was particularly notable because Dallas had started 2026 relatively softly, with January–April ADR averaging $133.05, down 0.9% from the previous year. The World Cup therefore provided a concentrated summer boost, demonstrating how international sporting events can quickly strengthen hotel pricing, room revenue and visitor demand in major U.S. cities.
Advertisement
Advertisement
| Dallas Indicator | 2026 Result | YoY Change |
|---|---|---|
| Jan–Apr ADR | $133.05 | -0.9% |
| July 12–18 ADR | $144.41 | +21.5% |
| July 12–18 RevPAR | $96.81 | +26.6% |
Las Vegas — July Visitor Growth Signals a Turn After Tourism Weakness
Las Vegas showed important signs of recovery in July after a difficult period for its visitor economy. Visitor volume increased 2.7% year over year, reaching approximately 3.17 million, while hotel occupancy stood at 77.2%. Around 3.60 million room nights were sold, up 2.3%, while ADR increased 1.8% to $157.45 and RevPAR advanced 3.2% to $121.55. Strip gaming revenue also increased 3.6% to about $776.3 million. However, convention attendance remained 5.6% lower, suggesting that Las Vegas’ rebound was driven more strongly by leisure tourism than by business and convention demand.
| Las Vegas Indicator | July 2026 | YoY Change |
|---|---|---|
| Visitors | 3.17M | +2.7% |
| Hotel occupancy | 77.2% | Higher |
| Room nights sold | 3.60M | +2.3% |
| ADR | $157.45 | +1.8% |
| RevPAR | $121.55 | +3.2% |
| Convention attendance | — | -5.6% |
Houston — World Cup Matches Send Hotel Revenue Sharply Higher
Houston joined the summer rebound as World Cup matches injected additional demand into its hotel market. During June 14–20, when Houston hosted tournament matches, revenue per available room surged 28.1% to $100.01. That represented a significant acceleration from earlier in the year, when Houston’s January–April average room rate stood at $131.13, up a more moderate 4.3% from $125.67 in 2025. The June performance illustrates how major international sporting events amplified an already improving accommodation market. Additional visitors translated into stronger room revenues and demonstrated the ability of event tourism to create concentrated economic gains during the crucial summer travel period.
Advertisement
Advertisement
| Houston Indicator | 2026 Result | YoY Change |
|---|---|---|
| Jan–Apr ADR | $131.13 | +4.3% |
| June 14–20 RevPAR | $100.01 | +28.1% |
Seattle — World Cup Tourism Drives a Sharp Jump in Hotel Rates
Seattle’s summer hotel market received a significant boost from World Cup tourism. During June 14–20, when the city hosted tournament matches, average daily hotel rates jumped 30.5% to $271.80. That represented a dramatic acceleration from the opening four months of 2026, when Seattle’s ADR averaged $154.38, only 0.9% above the $153.05 recorded in 2025. The contrast illustrates the impact that concentrated international sporting demand can have on an urban hotel market. Seattle’s summer rebound was therefore not simply about additional visitors but about stronger pricing power as major events increased competition for available rooms.
| Seattle Indicator | 2026 Result | YoY Change |
|---|---|---|
| Jan–Apr ADR | $154.38 | +0.9% |
| June 14–20 ADR | $271.80 | +30.5% |
U.S. Cities Enter Summer With Stronger Tourism Momentum
The city-level rebound reflects a wider improvement across the American hotel sector. In June, national hotel occupancy reached 69.6%, up 1.6%, while ADR increased 6.7% to $173.76 and RevPAR climbed 8.4% to $120.97. July strengthened the picture further, with U.S. travel spending reaching $122.8 billion, up 5.8%, while hotel room demand increased 2.8%. Urban hotel RevPAR advanced 14.8%, substantially outperforming the 5.5% increase at resort properties. The 2026 summer story therefore points to a strong urban and event-driven rebound, particularly in cities benefiting from major sports, entertainment and business events.
| U.S. Summer Tourism Indicator | 2026 Result | Change |
|---|---|---|
| June hotel occupancy | 69.6% | +1.6% |
| June ADR | $173.76 | +6.7% |
| June RevPAR | $120.97 | +8.4% |
| July travel spending | $122.8B | +5.8% |
| July hotel room demand | — | +2.8% |
| Urban hotel RevPAR | — | +14.8% |
| Resort hotel RevPAR | — | +5.5% |
Las Vegas joined San Francisco and others as US cities staged a powerful summer tourism rebound in 2026, driven by stronger visitor arrivals, major events, improved hotel performance and renewed leisure demand that boosted destinations across the country.
In conclusion, Las Vegas joined San Francisco and others as US cities staged a powerful summer tourism rebound in 2026, supported by major events, rising visitor demand, stronger hotel performance and renewed leisure travel activity. The recovery across leading destinations showed how event-driven tourism, international attractions and improved traveller confidence helped boost urban economies, increase accommodation revenues and strengthen the wider US tourism landscape. Las Vegas and other cities demonstrated that strategic event hosting and diverse visitor experiences played a key role in creating sustained summer momentum throughout 2026.
Advertisement
