
San Francisco Stands With New York City and Other US Cities in Hammering Mexican Tourism With a Drop in Tourist Arrivals for Eight Consecutive Months in 2026

Published
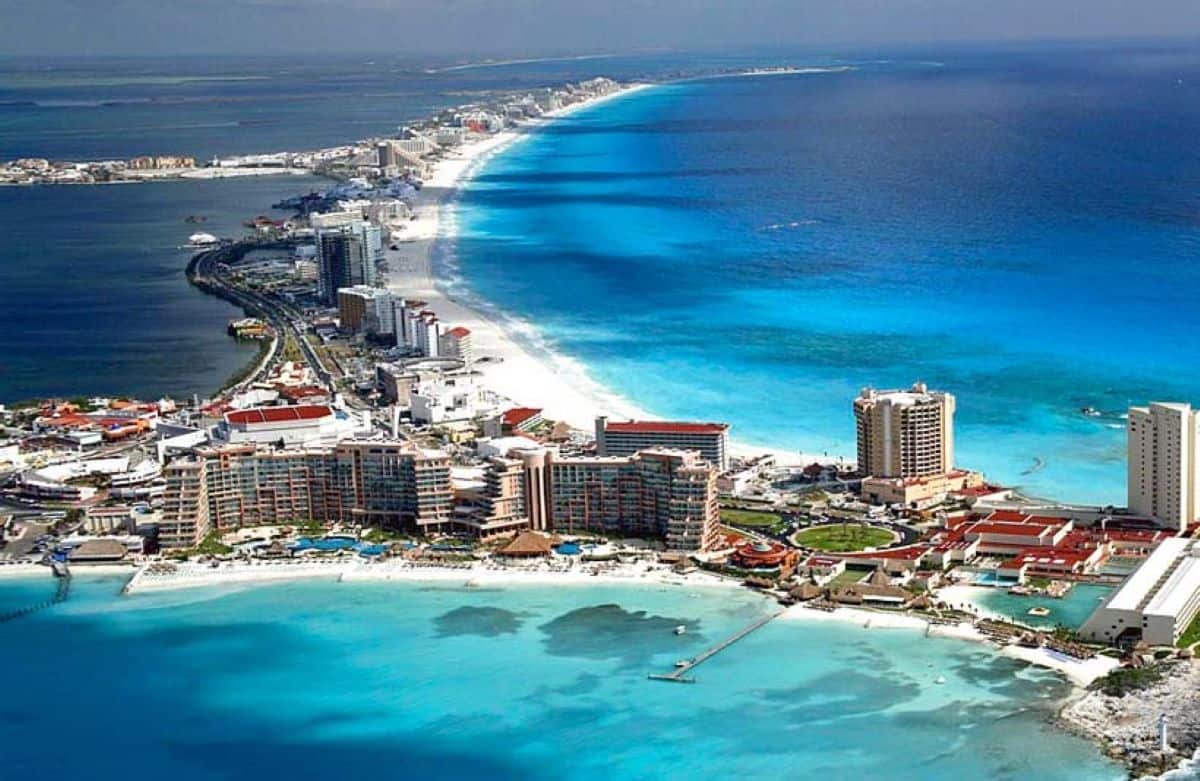
San Francisco stands with New York City and other US cities in hammering Mexican tourism with a drop in tourist arrivals for eight consecutive months in 2026 as US citizen-originating air passenger traffic from major markets declines due to changing travel demand, airline capacity shifts and broader market pressures.
A clear weakness is emerging in an important segment of Mexico’s tourism market in 2026. The supplied city-level data for US citizen-originating air passengers travelling from San Francisco, Oakland, Phoenix and New York City to Mexico show broad year-on-year declines between January and August. Combined traffic across these four markets fell from 1,300,459 to 1,136,898 passengers, representing 163,561 fewer travellers and a 12.6% decline. The pattern is particularly significant in San Francisco, Phoenix and New York City, where every month recorded a decline. Oakland began the year with growth before experiencing a sharp reversal from April.
Advertisement
Advertisement
San Francisco: Eight Straight Months of Decline Deliver the Sharpest Blow
San Francisco recorded the steepest overall contraction among the four markets. US citizen-originating traffic to Mexico declined during every month from January through August. The fall began at 6.1% in January and 7.0% in February before accelerating to 24.1% in March and 20.9% in April. June produced the biggest decline, falling 25.9% from 58,140 to 43,063 passengers. July remained down 19.3%, followed by another 22.8% contraction in August. Overall traffic dropped from 381,066 to 313,095, eliminating 67,971 passengers and producing a 17.8% decline. Reduced airline capacity between the US and Mexico, changing airline deployment and the stronger Mexican peso provide important context for the weakness.
| Month | 2025 | 2026 | YoY Change |
|---|---|---|---|
| January | 46,000 | 43,202 | −6.1% |
| February | 42,063 | 39,117 | −7.0% |
| March | 52,359 | 39,715 | −24.1% |
| April | 50,191 | 39,706 | −20.9% |
| May | 41,399 | 36,126 | −12.7% |
| June | 58,140 | 43,063 | −25.9% |
| July | 56,396 | 45,503 | −19.3% |
| August | 34,518 | 26,663 | −22.8% |
| Jan–Aug Total | 381,066 | 313,095 | −17.8% |
New York City: Eight Consecutive Declines Signal Persistent Weakness
New York City recorded eight consecutive months of declining US citizen-originating traffic to Mexico. The downturn initially remained relatively modest, with January falling 4.4% and February 3.8%. Conditions weakened significantly during spring. March declined 10.5%, while April produced the sharpest contraction at 16.8%, with traffic dropping from 52,597 to 43,756 passengers. May, June and July remained down by 10.8%, 10.6% and 11.3%, respectively. August showed signs of improvement but still finished 3.3% below the previous year. Across January–August, New York traffic fell from 375,438 to 341,577. That represents 33,861 fewer passengers and an overall 9.0% contraction, reinforcing evidence of weaker US-originating demand from several major metropolitan markets.
Advertisement
Advertisement
| Month | 2025 | 2026 | YoY Change |
|---|---|---|---|
| January | 46,143 | 44,119 | −4.4% |
| February | 51,325 | 49,395 | −3.8% |
| March | 51,626 | 46,210 | −10.5% |
| April | 52,597 | 43,756 | −16.8% |
| May | 40,816 | 36,398 | −10.8% |
| June | 41,242 | 36,856 | −10.6% |
| July | 47,833 | 42,428 | −11.3% |
| August | 43,856 | 42,415 | −3.3% |
| Jan–Aug Total | 375,438 | 341,577 | −9.0% |
Oakland: Early Growth Turns Into a Severe Five-Month Slide
Oakland presents a different but equally striking pattern. Traffic initially increased by 6.7% in January and 7.5% in February, while March remained 0.9% above the previous year. The market then reversed dramatically. April fell 15.1%, May dropped 23.0%, and June recorded the steepest monthly contraction at 29.6%, falling from 18,666 to 13,148 passengers. July remained 16.1% below 2025, before August suffered another 27.9% decline. Consequently, three months of early resilience were overwhelmed by five consecutive months of contraction. January–August traffic dropped from 121,780 to 106,682, representing 15,098 fewer travellers and a 12.4% decline. Reduced air capacity and changing airline schedules could be contributing to the weakness.
Advertisement
Advertisement
| Month | 2025 | 2026 | YoY Change |
|---|---|---|---|
| January | 13,903 | 14,841 | +6.7% |
| February | 14,924 | 16,041 | +7.5% |
| March | 15,319 | 15,464 | +0.9% |
| April | 15,057 | 12,790 | −15.1% |
| May | 13,484 | 10,387 | −23.0% |
| June | 18,666 | 13,148 | −29.6% |
| July | 17,628 | 14,782 | −16.1% |
| August | 12,799 | 9,229 | −27.9% |
| Jan–Aug Total | 121,780 | 106,682 | −12.4% |
Phoenix: Mexico-Bound Traffic Falls in Every Month
Phoenix represents another sustained source-market decline. Every month between January and August recorded fewer US citizen-originating passengers travelling to Mexico than during the corresponding month of 2025. January was almost unchanged, declining only 0.4%, before February dropped 9.0%. March brought the biggest shock, with traffic plunging 23.0% from 68,210 to 52,551 passengers. April declined 9.5%, May 12.8%, June 9.0% and July 7.3%. August then weakened further with a 15.7% fall. Across the eight months, Phoenix traffic dropped from 422,175 to 375,544, representing 46,631 fewer passengers and an overall decline of 11.0%. Airline capacity changes, pricing and currency conditions could all be contributing factors.
| Month | 2025 | 2026 | YoY Change |
|---|---|---|---|
| January | 53,448 | 53,222 | −0.4% |
| February | 54,547 | 49,616 | −9.0% |
| March | 68,210 | 52,551 | −23.0% |
| April | 52,264 | 47,308 | −9.5% |
| May | 54,805 | 47,809 | −12.8% |
| June | 55,128 | 50,177 | −9.0% |
| July | 50,298 | 46,628 | −7.3% |
| August | 33,475 | 28,233 | −15.7% |
| Jan–Aug Total | 422,175 | 375,544 | −11.0% |
Four Major US Markets Send 163,561 Fewer Passengers to Mexico
Together, these four origin markets reveal substantial weakness in an important part of Mexico’s US tourism pipeline. Combined US citizen-originating traffic fell from 1,300,459 passengers during January–August 2025 to 1,136,898 during the same period of 2026. That represents 163,561 fewer passengers and a combined contraction of 12.6%. San Francisco recorded the steepest overall decline at 17.8%, followed by Oakland at 12.4%, Phoenix at 11.0% and New York City at 9.0%. The declines coincide with broader reductions in US–Mexico airline capacity and come amid changing airfares, airline network decisions, currency movements and wider economic uncertainty.
| US Origin Market | Jan–Aug 2025 | Jan–Aug 2026 | Passenger Decline | YoY Change |
|---|---|---|---|---|
| San Francisco | 381,066 | 313,095 | −67,971 | −17.8% |
| Oakland | 121,780 | 106,682 | −15,098 | −12.4% |
| Phoenix | 422,175 | 375,544 | −46,631 | −11.0% |
| New York City | 375,438 | 341,577 | −33,861 | −9.0% |
| Combined | 1,300,459 | 1,136,898 | −163,561 | −12.6% |
The trend should not be described as a collapse in all US travel to Mexico. Los Angeles, for example, moved in the opposite direction in the supplied data, increasing 4.7% during January–August. The stronger conclusion is that several important US origin markets are producing significantly fewer US citizen air passengers for Mexico in 2026, creating a geographically uneven challenge for the country’s tourism sector.
San Francisco stands with New York City and US other cities in hammering Mexican tourism with a drop in tourist arrivals for eight consecutive months in 2026 as declining US air passenger traffic, reduced capacity and changing travel patterns weaken visitor flows from major American markets.
In conclusion, San Francisco stands with New York City and other US cities in hammering Mexican tourism with a drop in tourist arrivals for eight consecutive months in 2026 as declining US citizen-originating air passenger traffic, changing travel behaviour and airline capacity adjustments reduce visitor flows from several major American markets. The trend highlights a geographically uneven challenge for Mexico’s tourism sector, where some source cities are weakening while others continue to show growth opportunities.
Advertisement
