
Vermont and Virginia Tourism Comparison Reveals America’s Top Nature Heritage and Seasonal Travel Experiences in 2026

Published
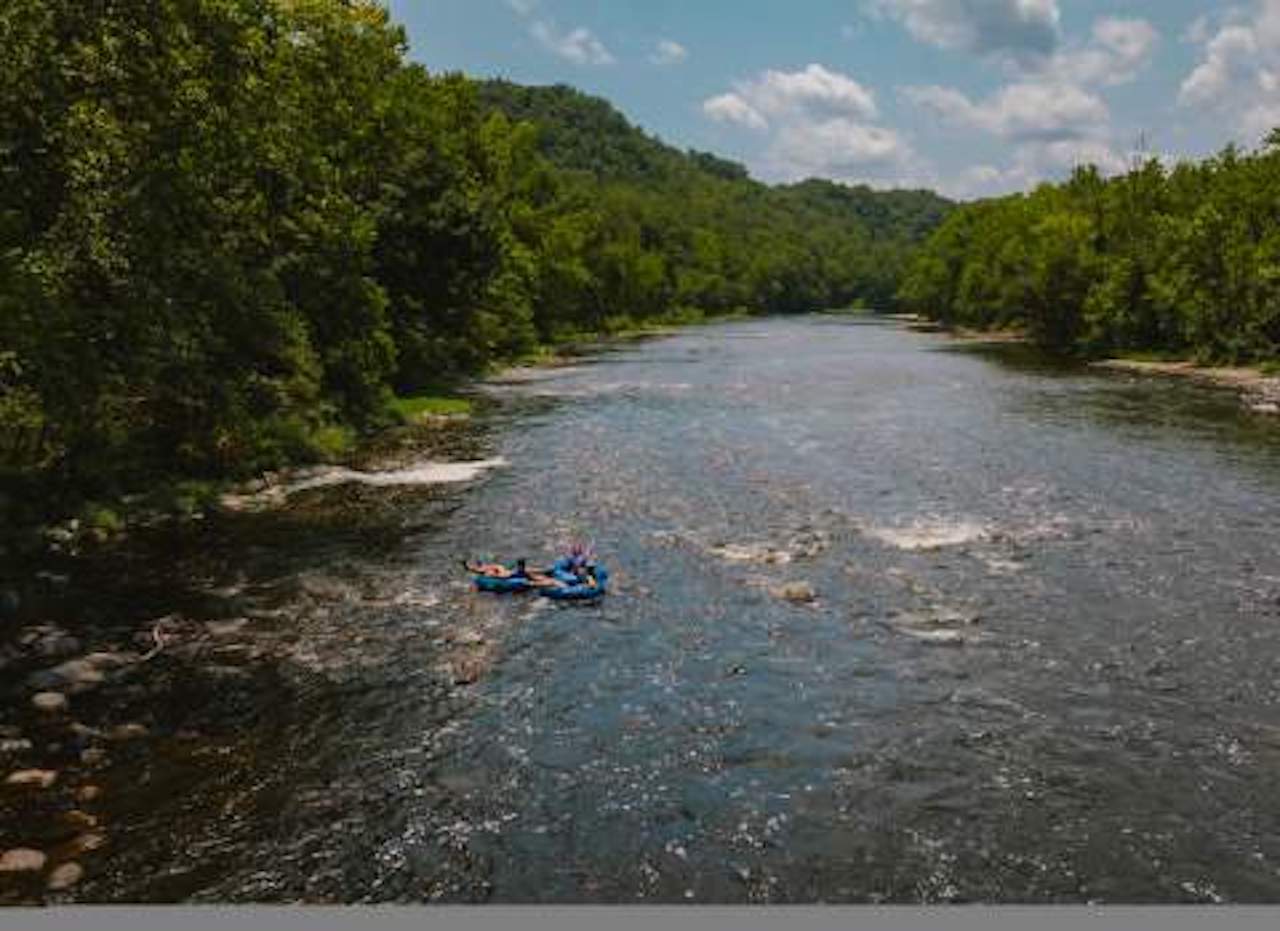
The United States continues to attract diverse travellers in 2025–2026, with each state offering a different tourism identity. Texas leads through major cities, business travel, festivals and large-scale attractions. Utah attracts adventure travellers through national parks, outdoor experiences and scenic landscapes. Vermont remains a preferred destination for nature, wellness and seasonal tourism, especially autumn and winter travel. Virginia combines history, beaches, wine tourism and family experiences, attracting visitors seeking culture and heritage.
Tourism Comparison Table 2025–2026
| State | Main Tourism Identity | Key Traveller Markets | Why Travellers Visit | Major Tourism Strengths |
|---|---|---|---|---|
| Texas | Urban, cultural, business and entertainment tourism | Domestic US travellers, business visitors, Mexico and international visitors | Cities, food, music, sports, theme parks, ranch experiences | Houston, Austin, Dallas, San Antonio, Gulf Coast |
| Utah | Adventure and nature tourism | US outdoor travellers, international adventure seekers | National parks, hiking, skiing, scenic road trips | Mighty Five national parks, ski resorts, outdoor recreation |
| Vermont | Nature, wellness and seasonal tourism | Domestic leisure travellers, couples, families, autumn visitors | Fall colours, skiing, villages, farms, wellness escapes | Green Mountains, foliage tourism, winter sports |
| Virginia | Heritage, coastal and cultural tourism | Domestic families, history travellers, international visitors | Colonial history, beaches, wineries, museums | Williamsburg, Shenandoah, Virginia Beach, wine routes |
Tourism Comparison 2025–2026: Texas, Utah, Vermont and Virginia
Texas: The Volume Leader
Visitors spent more than $98.7 billion in Texas in 2025, after a record 62 million travelers in 2024. Most visitors are domestic: families, road-trippers, business and convention travelers, and event fans heading to Houston, Dallas, Austin and San Antonio. Popular stops include the Alamo, Space Center Houston and the Fort Worth Stockyards. Mexico is an especially important international market for Houston.
Advertisement
Advertisement
In 2026, the World Cup brought 16 games to Houston and Dallas-Arlington. However, hotels reported bookings below expectations, with domestic travelers outpacing international ones, partly because of visa delays and rising costs.
Why they come: huge variety in one state (big cities, Gulf beaches, ranch culture, barbecue, live music), major airport hubs, and a packed calendar of sports and conventions.
Advertisement
Advertisement
| Traveller Type | Why They Come | Peak Timing | 2025–26 Trend |
|---|---|---|---|
| Domestic leisure and families | Cities, theme parks, beaches, road trips | Spring, summer | Strong, record spending |
| Business and convention | Houston and Dallas hubs, corporate events | Year-round | Houston metro hosted 730,000 citywide meeting attendees in 2025 |
| Mexican and international | Shopping, family ties, medical care, NASA | Holidays | Softer international bookings around the World Cup |
| Sports and event fans | World Cup, rodeos, festivals | June–July 2026 | About $3.5 billion impact estimated, but tempered |
| Outdoor and nature | Big Bend, Hill Country, Gulf Coast | Spring, autumn | Big Bend visits up about 1.2% to over 568,000 in 2025 |
Utah: The Outdoor Adventure Specialist
Utah visitors spent a record $13.7 billion in 2025, up 0.6% after inflation, even as visitation softened. Leisure travel made up over 92% of spending, and out-of-state and international visitors outspent residents by more than four to one. The typical traveller is a hiker, photographer, skier, road-tripper or international nature tourist heading to the “Mighty 5” national parks. Zion alone drew over 4.9 million visits.
Still, national park visits fell 4.5% and state park visits fell 5.8% in 2025. The 2025–26 winter also brought poor snow in western mountain states, especially Colorado and Utah. Why they come: red-rock landscapes, five national parks within one road trip, world-class skiing, and easy access from Salt Lake City airport.
Advertisement
Advertisement
| Traveller Type | Why They Come | Peak Timing | 2025–26 Trend |
|---|---|---|---|
| Hikers and park-goers | Zion, Arches, Bryce, Canyonlands, Capitol Reef | Spring, autumn | National park visits down 4.5% |
| International nature tourists | Iconic desert scenery, road trips | Spring–autumn | Part of nonresident spending that dominates the industry |
| Skiers and snowboarders | Resorts near Salt Lake City | Dec–Mar | Weak western snow was a headwind |
| State-park and water recreation | Lakes, dunes, reservoirs | Summer | State park visits down 5.8% |
| Domestic leisure (drive-in) | Affordable weekend escapes | Year-round | Spending still a record $13.7 billion |
Vermont: Small, Scenic and Border-Dependent
Vermont’s newest full-year data is from 2024, when 16 million visitors spent a record $4.2 billion, about 9% of state GDP. Most travellers are Northeast drive-in visitors, plus leaf-peepers, skiers, cyclists and food lovers. Canadians are the vulnerable segment: they were 5% of statewide visits but over 30% in the northernmost counties.
Canadian land travel to the U.S. fell 31% in 2025, and Canadian credit-card spending in October was down almost 50%. Even so, the 2025–26 ski season logged 4.36 million skier visits, the strongest since 2014–15. Why they come: fall foliage, ski resorts, farm-to-table food, and villages within a few hours of Boston and New York.
Advertisement
Advertisement
| Traveller Type | Why They Come | Peak Timing | 2025–26 Trend |
|---|---|---|---|
| Northeast drive-in visitors | Short getaways from Boston, New York | Year-round | Solid, the main growth base |
| Fall foliage travellers | Leaf-peeping, scenic drives | Late Sep–Oct | Some towns restricted non-local traffic at popular foliage spots |
| Skiers and snowboarders | Stowe, Killington, Sugarbush, Jay Peak | Dec–Mar | Up 4.7% year over year |
| Canadian visitors | Cross-border trips, skiing, hockey | Winter, summer | Sharply down; Jay Peak’s hockey business off about 25% |
| Cyclists and foodies | Kingdom Trails, cheese, cider, craft beer | Summer–autumn | Mixed, hurt by fewer Canadians |
Virginia: The Balanced All-Rounder
Virginia’s 2025 visitor spending reached a record $36.2 billion, up 3.1%, the fourth straight year of growth. About 46.6 million overnight visitors came, the second consecutive record. Leisure travel made up 90% of overnight visitation, as travelers sought high-value destinations closer to home.
The main travellers are East Coast families, history enthusiasts, beachgoers, hikers and wine or craft-beverage fans, along with business visitors linked to the Washington, D.C. area. I
nternational visitation declined 11.1%. Central Virginia, the Shenandoah Valley and the Virginia Mountains led hotel demand growth. Through June 2026, hotel demand rose 3.1% versus 1.8% nationwide. Why they come: Colonial history, Shenandoah scenery, Virginia Beach, and short drives from major population centres.
| Traveller Type | Why They Come | Peak Timing | 2025–26 Trend |
|---|---|---|---|
| Domestic leisure and families | Beaches, theme parks, history | Summer | Leisure is 90% of overnight visits |
| History and heritage visitors | Williamsburg, Richmond, Charlottesville | Spring, autumn | Strong hotel gains in central Virginia |
| Outdoor and mountain travellers | Shenandoah, Blue Ridge, Roanoke | May–Oct | Shenandoah Valley and mountains among the top growth regions |
| Business and government travellers | D.C. region, corporate and military ties | Year-round | Steady |
| International visitors | Heritage, D.C. gateway trips | Summer | Down 11.1% |
Four-State Comparison (2025–2026)
| Factor | Texas | Utah | Vermont | Virginia |
|---|---|---|---|---|
| Latest visitor spending | $98.7B (2025) | $13.7B (2025) | $4.2B (2024, latest full data) | $36.2B (2025) |
| Visitor volume | 62M travelers (2024) | 10.6M national park visits | 16M (2024) | 46.6M overnight visitors |
| Biggest traveller group | Domestic leisure, business and events | Outdoor and park-focused leisure | Northeast drive-in, ski and foliage | East Coast leisure and history |
| Main pull | Cities, events, culture | National parks, skiing | Foliage, skiing, villages | History, beaches, mountains |
| Key 2025–26 trend | Record spending; World Cup boost weaker than hoped | Record spending, but park visits down | Canadian slump; record ski season | Fourth straight record; international down |
| Main risk | Weak international demand | Snow and visitation softness | Canadian boycott | Fewer overseas visitors |
| Best for | Big-city, event and family trips | Hiking and road trips | Autumn, skiing, relaxed getaways | Balanced history and nature trips |
Texas, Utah, Vermont and Virginia represent four different models of American tourism growth in 2025–2026. Texas benefits from scale, business travel and urban attractions. Utah continues rising as a global adventure destination. Vermont strengthens its position through seasonal and sustainable travel. Virginia attracts visitors through history, nature and coastal experiences.
Advertisement
Advertisement
For travellers, the choice depends on travel style: Texas suits visitors seeking energy and entertainment, Utah offers dramatic outdoor exploration, Vermont delivers peaceful seasonal escapes, and Virginia provides a complete cultural and coastal journey.
Advertisement
