
American Worst Rush-Hour Cities Revealed as New York Drivers Lose 125 Hours Every Year

Published
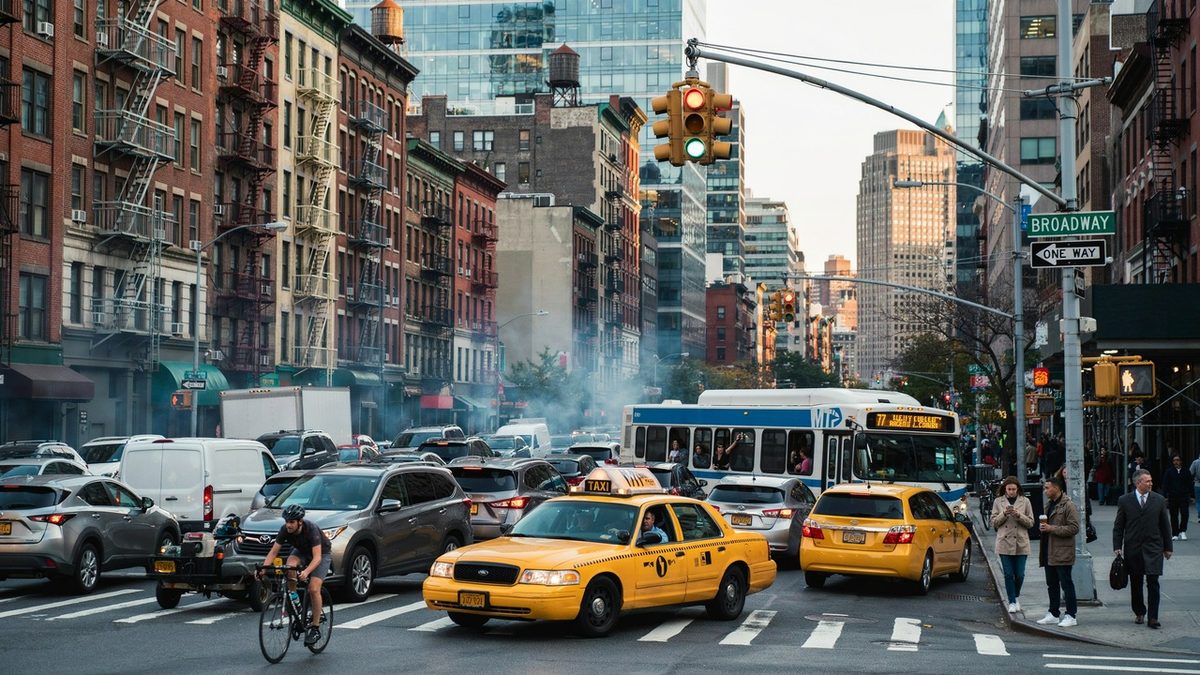
Image generated with Ai
America’s worst rush-hour cities are revealed, and New York leads the list. Drivers lose 125 hours a year, while San Francisco and Honolulu also face heavy traffic and costly delays. America’s worst rush-hour cities have been revealed, and New York takes the unwanted top spot.
Drivers in the city lose 125 hours each year during rush hour, according to a study by FLBR Motorsport. The finding highlights how traffic can shape everyday travel, commuting and urban mobility.
Advertisement
Advertisement
San Francisco follows with 116 hours, while Honolulu records 88. Meanwhile, Boston, Los Angeles and Chicago also rank among the cities where drivers lose substantial time. For travellers, these figures offer a useful reminder that journey times can vary sharply by destination and time of day. Ultimately, rush-hour congestion remains an important consideration when planning movement through major American cities.
Rush-hour congestion is not simply an inconvenience for commuters. It can change how people plan journeys, how long visitors spend travelling between attractions, and how efficiently businesses, airports, hotels and tourism operators move people around major urban areas.
Advertisement
Advertisement
A new study by FLBR Motorsport, covering 91 US cities, highlights the striking difference in time lost during peak-hour congestion. At the top of the ranking, New York drivers lose 125 hours annually, equivalent to more than five full 24-hour days. At the other end, drivers in several lower-ranked cities lose only about 12 hours a year. A new study by FLBR Motorsport analyzed 91 cities and it revealed where drivers lose the most time during peak-hour congestion, with annual losses ranging from more than five full days in New York to just 12 hours in the lowest-ranked cities.
The figures provide a useful snapshot of how congestion affects urban mobility across the United States.
Advertisement
Advertisement
Full ranking:
| Rank | City | State | Time Lost during Rush Hour (hrs) |
| 1 | New York | NY | 125 |
| 2 | San Francisco | CA | 116 |
| 3 | Honolulu | HI | 88 |
| 4 | Boston | MA | 86 |
| 5 | Los Angeles | CA | 83 |
| 6 | Chicago | IL | 79 |
| 7 | Miami | FL | 72 |
| 7 | Philadelphia | PA | 72 |
| 7 | Washington | DC | 72 |
| 10 | Baltimore | MD | 71 |
| 11 | Seattle | WA | 69 |
| 12 | Atlanta | GA | 61 |
| 12 | Pittsburgh | PA | 61 |
| 14 | Austin | TX | 60 |
| 14 | Providence | RI | 60 |
| 16 | Columbia | SC | 58 |
| 17 | Tampa | FL | 57 |
| 17 | Nashville | TN | 57 |
| 19 | Houston | TX | 56 |
| 19 | Dallas | TX | 56 |
| 21 | New Orleans | LA | 54 |
| 22 | San Jose | CA | 52 |
| 23 | Denver | CO | 51 |
| 23 | Portland | OR | 51 |
| 25 | Worcester | MA | 49 |
| 25 | Charlotte | NC | 49 |
| 25 | Allentown | PA | 49 |
| 28 | Charleston | SC | 48 |
| 28 | New Haven | CT | 48 |
| 30 | Oxnard | CA | 47 |
| 30 | Baton Rouge | LA | 47 |
| 30 | Boise | ID | 47 |
| 33 | Greenville | SC | 44 |
| 34 | Las Vegas | NV | 43 |
| 35 | Cape Coral | FL | 42 |
| 35 | Anchorage | AK | 42 |
| 37 | McAllen | TX | 40 |
| 37 | Indianapolis | IN | 40 |
| 39 | Riverside | CA | 39 |
| 39 | Fort Myers | FL | 39 |
| 39 | Long Beach | CA | 39 |
| 39 | Minneapolis | MN | 39 |
| 43 | Sacramento | CA | 38 |
| 43 | San Diego | CA | 38 |
| 45 | Anaheim | CA | 37 |
| 45 | Portland | ME | 37 |
| 45 | Milwaukee | WI | 37 |
| 48 | Phoenix | AZ | 34 |
| 49 | Richmond | VA | 33 |
| 50 | Louisville | KY | 31 |
| 50 | Jacksonville | FL | 31 |
| 50 | Columbus | OH | 31 |
| 50 | Birmingham | AL | 31 |
| 54 | El Paso | TX | 30 |
| 54 | Fort Worth | TX | 30 |
| 54 | Saint Louis | MO | 30 |
| 54 | Syracuse | NY | 30 |
| 58 | Ventura | CA | 29 |
| 58 | Tucson | AZ | 29 |
| 58 | Orlando | FL | 29 |
| 58 | Raleigh | NC | 29 |
| 58 | Albuquerque | NM | 29 |
| 58 | Cincinnati | OH | 29 |
| 58 | San Antonio | TX | 29 |
| 65 | Greensboro | NC | 28 |
| 65 | Detroit | MI | 28 |
| 67 | Colorado Springs | CO | 26 |
| 67 | Buffalo | NY | 26 |
| 69 | Knoxville | TN | 25 |
| 69 | Rochester | NY | 25 |
| 71 | Virginia Beach | VA | 24 |
| 71 | Salt Lake City | UT | 24 |
| 71 | Cleveland | OH | 24 |
| 71 | Grand Rapids | MI | 24 |
| 75 | Bakersfield | CA | 21 |
| 75 | Winston-Salem | NC | 21 |
| 75 | Kansas City | MO | 21 |
| 78 | Thousand Oaks | CA | 20 |
| 78 | High Point | NC | 20 |
| 78 | Oklahoma City | OK | 20 |
| 81 | Fresno | CA | 19 |
| 81 | Memphis | TN | 19 |
| 81 | Little Rock | AR | 19 |
| 84 | Mesa | AZ | 17 |
| 84 | Des Moines | IA | 17 |
| 86 | Dayton | OH | 16 |
| 87 | Akron | OH | 15 |
| 88 | Omaha | NE | 14 |
| 89 | Tulsa | OK | 12 |
| 89 | Wichita | KS | 12 |
| 89 | Council Bluffs | IA | 12 |
New York records the biggest rush-hour time loss
New York ranks first, with drivers losing an estimated 125 hours each year during rush hour.
Advertisement
Advertisement
That puts the city nine hours ahead of second-placed San Francisco and 54 hours ahead of Baltimore, which ranks tenth.
New York’s position is understandable given the complexity of its transport network. The city has an enormous commuter population, dense development and a road system that must handle heavy demand across bridges, tunnels and major arterial routes.
For visitors, the implications can be significant. A journey that looks short on a map can take considerably longer during peak periods. Airport transfers, hotel journeys, sightseeing trips and business appointments may all require additional time.
The ranking therefore offers more than a commuter statistic. It also illustrates why travellers visiting major US cities should consider the time of day when planning road journeys.
Advertisement
Advertisement
San Francisco and Honolulu follow
San Francisco ranks second, with 116 hours lost annually.
The city is followed by Honolulu, where drivers lose 88 hours during rush hour.
Honolulu’s third-place position stands out because it has a considerably smaller population than America’s largest metropolitan areas. However, geography and the concentration of development can put substantial pressure on available road corridors.
For tourists, Honolulu’s ranking is particularly relevant. Visitors may associate Hawaii primarily with beaches, resorts and leisure travel, but getting between accommodation, attractions and other parts of Oahu can still involve significant peak-period delays.
San Francisco presents a different urban pattern. Its dense built environment, major employment centres and constrained road geography contribute to heavy traffic at busy times.
Boston and Los Angeles remain major congestion hotspots
Boston ranks fourth, with 86 hours lost each year.
Advertisement
Advertisement
It is followed by Los Angeles, at 83 hours.
Los Angeles has long been synonymous with traffic congestion, making its position unsurprising. Yet the study reveals an interesting comparison: drivers in Los Angeles lose 42 fewer hours annually than drivers in New York.
That difference shows why reputation alone does not tell the full story. A city can have a notorious traffic problem while another urban area produces a larger annual time loss under the methodology used in a particular study.
For travellers, the practical lesson is straightforward. Popular destinations should not automatically be assessed by their reputation for traffic. Actual journey conditions can vary according to location, road capacity, commuting patterns and peak-hour demand.
Chicago, Miami, Philadelphia and Washington follow
Chicago ranks sixth, with 79 hours lost annually.
Three cities then share seventh place: Miami, Philadelphia and Washington, D.C., each recording 72 hours.
Advertisement
Advertisement
These cities represent very different travel markets.
Miami combines a large metropolitan population with significant visitor traffic and commuter demand. Philadelphia has dense urban areas and major regional connections, while Washington, D.C., experiences intense weekday movement involving commuters, government workers, businesses and visitors.
The common factor is concentration. Where large numbers of people need to use road infrastructure at similar times, congestion can quickly become a major mobility issue.
Baltimore completes the top 10
Baltimore ranks tenth, with 71 hours lost during rush hour each year.
That is only one hour below Miami, Philadelphia and Washington, D.C.
The narrow gap demonstrates how tightly grouped the leading congestion-affected cities are. The top 10 average 86.4 hours of lost time annually, according to the figures supplied in the study.
Advertisement
Advertisement
The broader ranking also shows that congestion is not confined to the country’s biggest population centres.
Seattle and Atlanta also record significant losses
Outside the top 10, Seattle ranks 11th, with drivers losing 69 hours.
Atlanta and Pittsburgh share 12th place, each at 61 hours, while Austin and Providence jointly occupy 14th place with 60 hours.
Other cities recording relatively high losses include Columbia, South Carolina, at 58 hours; Tampa and Nashville, at 57 hours; and Houston and Dallas, at 56 hours each.
New Orleans records 54 hours, while San Jose stands at 52.
Denver and Portland, Oregon, each record 51 hours.
Advertisement
Advertisement
The spread demonstrates that serious rush-hour delays occur across a broad range of American destinations, rather than being limited to New York, Los Angeles or other globally recognised traffic hotspots.
Mid-ranking cities show a wide divide
The ranking changes considerably through the middle of the table.
Worcester, Charlotte and Allentown each record 49 hours, followed by Charleston and New Haven at 48 hours. Oxnard, Baton Rouge and Boise each record 47 hours.
Greenville records 44 hours, while Las Vegas stands at 43.
Cape Coral and Anchorage each record 42 hours. McAllen and Indianapolis record 40 hours, while Riverside, Fort Myers, Long Beach and Minneapolis each stand at 39.
Sacramento and San Diego record 38 hours, while Anaheim, Portland in Maine and Milwaukee each record 37.
Advertisement
Advertisement
Phoenix, at 34 hours, is followed by Richmond at 33.
Further down the ranking, Louisville, Jacksonville, Columbus and Birmingham each record 31 hours.
El Paso, Fort Worth, St. Louis and Syracuse each record 30 hours.
Several US cities experience much lower losses
The lower end of the ranking provides a sharp contrast.
Ventura, Tucson, Orlando, Raleigh, Albuquerque, Cincinnati and San Antonio each record 29 hours. Greensboro and Detroit follow at 28 hours.
Colorado Springs and Buffalo record 26 hours, while Knoxville and Rochester each record 25.
Advertisement
Advertisement
Virginia Beach, Salt Lake City, Cleveland and Grand Rapids each record 24 hours.
Bakersfield, Winston-Salem and Kansas City record 21 hours.
Thousand Oaks, High Point and Oklahoma City each record 20 hours, while Fresno, Memphis and Little Rock each record 19.
Mesa and Des Moines record 17 hours, and Dayton records 16.
Akron records 15 hours, placing it among the cities with the smallest annual rush-hour losses in the supplied ranking.
Tulsa, Wichita and Council Bluffs record the lowest figures
According to the study details provided, Tulsa, Wichita and Council Bluffs each record only 12 hours of annual time lost during rush hour.
Advertisement
Advertisement
Omaha follows with 14 hours, while Akron records 15.
The difference between the extremes is substantial. A New York driver loses more than ten times the annual rush-hour time recorded in the lowest-ranked cities.
The supplied figures put the average loss across the bottom five at approximately 13 hours a year, compared with 86.4 hours across the top 10.
That gap illustrates how dramatically urban form and traffic demand can affect mobility.
What the findings mean for travellers
Rush-hour congestion matters to the travel industry because road travel is often an invisible part of the visitor experience.
A traveller may arrive on time at an airport but face delays reaching a hotel. A family may schedule several attractions in one day but lose valuable sightseeing time in traffic. Business travellers may also need to build larger buffers around meetings, conferences and airport transfers.
Advertisement
Advertisement
The study reinforces a simple planning principle: distance does not necessarily determine travel time.
Visitors travelling through New York, San Francisco, Honolulu, Boston, Los Angeles, Chicago, Miami, Philadelphia, Washington, D.C., or Baltimore may need to account for peak-hour conditions when planning road-based itineraries.
However, the figures should be interpreted as a comparative indicator rather than a guarantee of an individual’s exact delay. Traffic varies by route, day, weather, incidents, roadworks and travel time. The methodology and underlying data used by FLBR Motorsport should therefore be considered when assessing the precise meaning of each figure.
Why congestion remains a travel-industry issue
Traffic affects more than commuters. It can influence airport transfers, tour schedules, rental-car journeys, hotel accessibility and the amount of time visitors can realistically spend at destinations.
For tourism businesses, reliable journey-time planning can therefore become part of the customer experience.
For travellers, the practical response is equally clear: check traffic conditions before setting out, avoid the busiest periods where possible, allow additional transfer time and consider public transport when it provides a more predictable alternative.
Advertisement
Advertisement
Ultimately, the ranking demonstrates that America’s congestion problem is highly uneven. New York stands far above the lower end of the table, while cities such as Tulsa, Wichita and Council Bluffs report dramatically smaller annual rush-hour losses.
“Traffic congestion is increasingly becoming an important part of the travel experience, particularly in major destinations where visitors and residents compete for limited road capacity. These findings offer travellers a practical perspective on how much time can be lost during peak periods. For the travel industry, such information is valuable because journey planning directly affects airport transfers, sightseeing schedules, hotel arrivals and overall visitor satisfaction. New York’s 125-hour figure is striking, but the wider ranking is equally revealing because it shows that congestion varies significantly between American cities. Travel And Tour World believes that informed travellers can use such data to plan smarter, build realistic itineraries and make better transport choices. Understanding urban mobility is essential to delivering a smoother, more predictable travel experience.” says Anup Kumar Keshan, Editor-in-Chief, TTW
America’s worst rush-hour cities reveal a stark divide in how traffic affects everyday mobility and travel. New York leads the ranking, with drivers losing 125 hours annually, followed by San Francisco at 116 and Honolulu at 88. Boston, Los Angeles and Chicago also record substantial losses, while Miami, Philadelphia, Washington, D.C., and Baltimore complete the top 10. At the opposite end, Tulsa, Wichita and Council Bluffs record just 12 hours.
The findings matter beyond commuting because congestion can disrupt airport transfers, hotel arrivals, business appointments, tours and sightseeing. However, the figures are comparative estimates and should not be treated as a guarantee of individual journey times. Traffic conditions change with weather, incidents, roadworks, routes and travel periods. For visitors, the clearest takeaway is to plan around peak demand, check current conditions and allow additional time when travelling through America’s busiest urban destinations.
The main cause of the difference is the concentration of people, jobs and journeys on limited road infrastructure. Dense urban development can create bottlenecks, while bridges, tunnels and restricted corridors can further reduce route flexibility. The answer for travellers is better timing and realistic journey planning. Avoiding peak periods, checking live traffic and allowing extra transfer time can reduce the impact of delays. The reason this matters is practical: lost hours can affect airport connections, hotel check-ins, tours, meetings and sightseeing plans. New York illustrates the extreme, with 125 hours lost annually, while lower-ranked cities show how different urban conditions can produce far less congestion.
Advertisement
