New York Squares Off with Las Vegas and Nashville as New Year’s Eve Travel Exposes Stark Hotel Price Gaps

Published
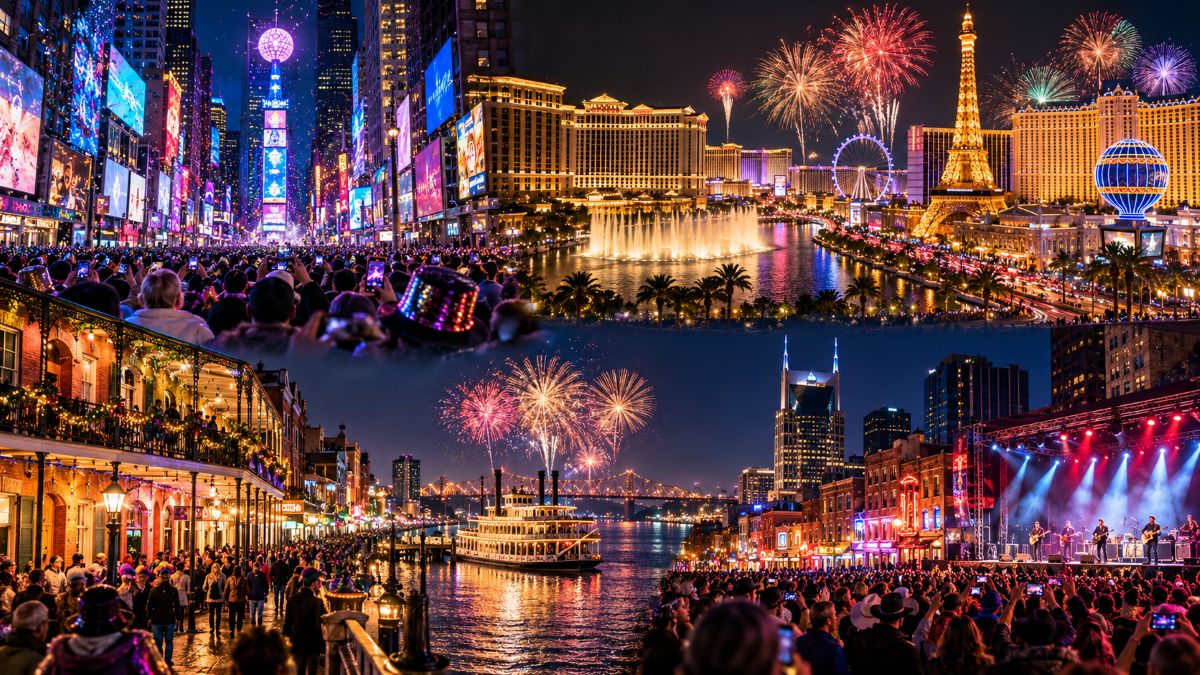
New York, Las Vegas, New Orleans and Nashville enter the 2026–27 New Year’s Eve travel race with contrasting tourism economies, headline celebrations and accommodation markets. New York recorded 65 million visitors and $55.6 billion in direct visitor spending in 2025, while Las Vegas attracted 38.5 million visitors. New Orleans welcomed 19.46 million visitors, and Nashville’s Davidson County generated $11.6 billion in visitor spending. Yet annual tourism figures cannot determine which city will command the highest December room rates or deliver the best holiday value. Nashville’s Big Bash generated $41 million in direct visitor spending in 2024, illustrating how one event can drive substantial activity. The decisive test is whether hotel premiums, overnight demand, visitor expenditure and trip duration justify each destination’s festive appeal.
Four Tourism Giants Enter a Different Kind of Race
The competition extends beyond the midnight countdown. Each city sells a different experience, attracting distinct visitor segments and generating revenue through different combinations of accommodation, entertainment, dining and transport. Consequently, the destination with the largest annual visitor total will not necessarily dominate the holiday period.
Advertisement
Advertisement
New York offers the international visibility of the Times Square Ball Drop. Las Vegas combines casino resorts, headline entertainment and a concentrated Strip celebration. New Orleans blends riverfront fireworks with French Quarter nightlife, while Nashville places live music at the centre of its festivities.
The latest completed annual figures establish the economic backdrop, although they cover different geographical areas and measurement systems. They should therefore be treated as context rather than a direct ranking of New Year’s Eve performance.
Advertisement
Advertisement
| Destination | Latest 2025 visitor or spending benchmark | Tourism significance |
|---|---|---|
| New York City | 65 million visitors; $55.6bn direct spending | Large urban market with strong hotel demand |
| Las Vegas | 38.5 million visitors; $33bn direct spending | Resort-led market with substantial room capacity |
| New Orleans | 19.46 million visitors; $10.8bn visitor spending | Culture-led destination with a significant visitor economy |
| Nashville / Davidson County | 17.4 million visitors; $11.6bn visitor spending | Music and event-led tourism market |
The comparison already exposes an important distinction. New York leads this group in total visitors, but Nashville’s event-driven model can produce substantial economic activity without matching New York’s overall scale. Meanwhile, Las Vegas’s large accommodation inventory creates a different pricing environment from New Orleans’s more compact historic districts.
New York’s Global Spectacle Comes at a Premium
New York enters the contest with formidable tourism fundamentals. Its 2025 visitor total reached 65 million, up 0.7% year on year, while direct visitor spending climbed to $55.6 billion. Tourism generated a wider $84.7 billion economic impact, supported approximately 397,000 jobs and produced $7.5 billion in tax revenue.
Advertisement
Advertisement
Hotels remain central to that performance. The city recorded 84.2% average occupancy and a $334 average daily room rate in 2025, with approximately 124,000 hotel rooms across the five boroughs. Annual occupancy ranked highest among the 25 largest US hotel markets covered by the city’s report.
For New Year’s Eve travellers, however, annual averages only establish the baseline. Times Square’s headline event draws an estimated crowd of around one million, according to reporting on the 2025–26 celebration. That concentration of demand can create pressure around central Manhattan, particularly for visitors seeking short walking distances to viewing areas.
The practical question is whether the convenience premium justifies the extra expenditure. Travellers can compare hotels farther from Times Square, provided they check subway access, planned service arrangements and post-midnight travel options. A room in another borough may reduce accommodation costs, although the journey and crowd-control arrangements need careful planning.
New York’s wider tourism economy also matters beyond the countdown. Museums, Broadway performances, restaurants and neighbourhood attractions can support a longer stay, spreading accommodation expenditure across more experiences. For travellers who want a full winter city break, that additional choice may justify a higher budget.
Las Vegas Tests the Power of Hotel Capacity
Las Vegas presents a contrasting proposition. Its 2025 visitor count fell 7.5% to approximately 38.5 million, while annual occupancy declined to 80.3%. The average daily room rate fell 5% to $183.52, and revenue per available room decreased 8.8% to $147.30. Nevertheless, the destination retained around 150,300 hotel rooms, the largest hotel inventory in the United States.
That inventory gives visitors a wider choice of accommodation categories, from budget-oriented properties to luxury resorts. However, a large hotel supply does not guarantee cheap rooms on 31 December. Demand can cluster around the Strip, while premium resorts may price rooms according to location, entertainment schedules and minimum-stay requirements.
Advertisement
Advertisement
The city’s average visitor trip lasts 3.2 nights, according to the Las Vegas Convention and Visitors Authority’s research. That makes a three-night holiday comparison particularly relevant, although it is a destination-wide average rather than a New Year’s Eve-specific figure.
Visitors should assess the complete booking cost, including resort fees, taxes, parking and transport. Some headline rates exclude mandatory charges, making apparently inexpensive rooms less competitive once the final bill appears. Travellers should also check whether a property requires a two- or three-night minimum stay.
Las Vegas could prove attractive to travellers who value choice, entertainment and a concentrated resort experience. Yet its 2025 decline in visitor numbers warns against assuming that a large destination automatically enjoys accelerating demand. The upcoming holiday’s hotel rates and occupancy data will be needed to establish whether New Year’s Eve reverses that broader trend.
New Orleans Makes Culture Part of the Holiday Value
New Orleans recorded 19.46 million visitors in 2025, up 2% from the previous year. Visitor spending reached $10.8 billion, an increase of $800 million, according to New Orleans & Company. Tourism and hospitality supported more than 85,000 jobs and careers, demonstrating the sector’s importance beyond seasonal celebrations.
The city’s New Year’s Eve offer centres on the French Quarter and Mississippi River waterfront. The official destination guide describes New Orleans Eve at Woldenberg Park as a free, open-air concert culminating in midnight fireworks. The wider programme can include riverboat cruises, restaurant celebrations and family-friendly daytime activities, although individual offerings and schedules vary each year.
This variety creates a different spending pattern from a destination built around a single headline attraction. Visitors can combine the countdown with historic neighbourhoods, live music, food and cultural experiences. A longer stay may therefore offer better value for travellers who want more than one evening of entertainment.
Advertisement
Advertisement
Nevertheless, a free public event does not make the entire holiday inexpensive. Accommodation near the French Quarter and riverfront can face concentrated demand, while special restaurant menus, ticketed performances and river cruises add to the bill. Travellers should compare lodging several neighbourhoods away, then calculate the cost of reaching the celebration.
New Orleans also requires careful interpretation of tourism data. Its annual visitor total includes trips throughout the year, not just overnight guests attending New Year’s Eve. Without event-specific hotel occupancy and visitor-spending figures, the city’s annual growth cannot establish whether the countdown is outperforming its rivals.
Nashville Turns Live Music Into Economic Momentum
Nashville offers one of the clearest examples of an individual celebration generating measurable visitor expenditure. Its Big Bash attracted 220,000 attendees and generated a reported $41 million in direct visitor spending during the 2024 event. The event’s organisers described the attendance as a record, highlighting the commercial significance of the live-music celebration.
The programme combines live performances, a midnight Music Note drop and national television exposure. Unlike an event that depends primarily on a single visual spectacle, Nashville’s celebration draws on the city’s broader identity as a live-music destination. Visitors can extend their trip with performances and entertainment around downtown, although venue admission and individual show prices vary.
Nashville’s wider tourism economy also merits attention. Davidson County generated $11.6 billion in visitor spending during 2025, up 3.5% year on year, while attracting 17.4 million daily and overnight visitors. The same report attributed $1.2 billion in state and local tax revenue to direct visitor spending.
These figures indicate that music and events sit within a much larger commercial ecosystem. Hotels, restaurants, transport operators and entertainment venues can all benefit from concentrated visitor activity. However, the $41 million Big Bash figure belongs to the 2024 celebration and must not be treated as Nashville’s annual tourism spending or as a confirmed result for the upcoming event.
Advertisement
Advertisement
For travellers, Nashville’s main appeal is the combination of a major public celebration and a music-led city break. The most useful comparison will examine hotel prices near the event, availability farther from downtown and the additional cost of attending performances on other nights.
The Hotel Premium Could Change the Winner
The most useful test for travellers is not simply which city charges the highest room rate. It is how much more accommodation costs during the celebration than during an ordinary period, measured using comparable rooms and booking conditions.
A historical hotel-price survey illustrates why this distinction matters. CheapHotels.org reported three-night prices for 30 December 2024 to 2 January 2025, compared with 13–16 January 2025. Its sample covered the cheapest qualifying double rooms and included taxes and fees. The results offer a historical snapshot, not a quotation for December 2026.
| Destination | Historical three-night price | Reported increase against comparison dates |
|---|---|---|
| New York City | $1,164 | 236% |
| Nashville | $727 | 45% |
| Las Vegas | $605 | 204% |
| New Orleans | $589 | 103% |
The pattern is revealing. New York’s sampled three-night price was almost twice Las Vegas’s, while Las Vegas recorded a much larger reported premium than Nashville. New Orleans had the lowest quoted total in this particular sample, but its reported increase exceeded Nashville’s.
These figures cannot establish the 2026–27 winner. Hotel inventory, demand, booking lead times, event schedules and rate conditions change between years. Nevertheless, they demonstrate why travellers should compare both the absolute price and the percentage premium.
A fair new survey should use the same arrival and departure dates, two adults sharing one room, identical cancellation conditions and the final price after mandatory fees. It should also distinguish central hotels from properties farther away, rather than combining unlike accommodation categories into a single ranking.
Advertisement
Advertisement
Room Availability Is Not the Same as Occupancy
A destination may have expensive rooms available while retaining unsold inventory. Conversely, popular hotels near a celebration may sell out even when rooms remain elsewhere in the city. That is why bookable availability, occupancy and room supply must be measured separately.
New York recorded approximately 124,000 hotel rooms and 84.2% annual occupancy in 2025. Las Vegas reported around 150,300 rooms and 80.3% annual occupancy. The figures suggest different supply and demand profiles, but neither reveals how many rooms will remain available for the specific 2026–27 holiday.
The reporting should therefore capture the number of comparable properties returning available rooms in each city, the quoted total and any minimum-stay restriction. A dated sample would provide a useful snapshot, although it would not represent every hotel or the full accommodation market.
Short-term rentals should be tracked separately where reliable data exist. They may offer alternatives to traditional hotels, but cleaning charges, service fees, cancellation terms and distance from the event can change the total cost substantially.
For visitors, the practical lesson is to assess the whole itinerary rather than chase a low headline rate. A cheaper room with difficult transport connections may offer less value than a moderately priced property within walking distance of restaurants and public transport.
Visitor Spending Needs a Fairer Scorecard
The four cities also compete through the money visitors spend after checking into their hotels. However, annual tourism expenditure and event-specific spending measure different economic activities. Combining them without clear labels could produce an impressive headline but a misleading comparison.
Advertisement
Advertisement
New York’s $55.6 billion in direct visitor spending covers the city’s entire tourism market. Las Vegas reported $33 billion in direct spending in its 2025 research summary, while New Orleans recorded $10.8 billion in visitor spending. Nashville’s $11.6 billion figure covers Davidson County, rather than the Big Bash alone.
Nashville’s $41 million event-specific figure is useful for a different reason. It links a defined celebration with estimated direct visitor spending, offering a more focused measure of the event’s commercial reach. Even then, the figure cannot be divided by annual visitors or compared directly with another city’s total tourism expenditure.
A robust investigation should seek comparable spending estimates for the same holiday window. Where those estimates are unavailable, the article should disclose the gap and use annual figures only to describe the broader economic setting.
| Spending measure | What it tells travellers and industry readers | Main limitation |
|---|---|---|
| Annual direct visitor spending | Scale of the wider tourism economy | Does not isolate New Year’s Eve |
| Event-attributed spending | Estimated commercial activity linked to a celebration | Methods and event boundaries may differ |
| Spending per overnight visitor | Potential value generated by a visitor staying in the destination | Requires consistent visitor and spending definitions |
| Hotel revenue per available room | Hotel revenue performance relative to room supply | Does not measure the visitor’s complete trip cost |
For tourism businesses, these distinctions matter because event attendance does not automatically translate into overnight bookings. A large crowd may include local residents, day visitors and people staying with friends or relatives. Hotels benefit most directly when an event generates additional room nights and supports stronger rates without deterring too many prospective visitors.
An Extra Night Can Change the Value Equation
Length of stay is a crucial but often overlooked part of the comparison. Las Vegas’s reported average visitor trip lasts 3.2 nights, providing a useful benchmark for examining a three-night holiday. However, the figure applies to visitors generally, not specifically to New Year’s Eve travellers.
A longer stay can spread travel costs across more experiences, particularly when visitors have already paid for flights or long-distance transport. It can also increase the total accommodation bill, food expenditure and the number of paid attractions. The outcome depends on whether the additional night brings enough value to justify its cost.
Advertisement
Advertisement
The following framework would make the article’s travel advice more useful than a simple hotel ranking.
| Trip component | Three-night comparison | Four-night comparison |
|---|---|---|
| Accommodation | Three nights, including taxes and mandatory fees | Four nights, including taxes and mandatory fees |
| Food and drink | Budget for each day and celebration night | Add the extra day’s meals |
| Local transport | Airport transfers and event-night journeys | Include additional journeys |
| Entertainment | Main celebration and selected activities | Add another day of attractions or performances |
| Overall value | Lower total outlay, shorter visit | Higher total outlay, potentially more experiences |
The final article should price this basket in each destination using the same travel dates and traveller assumptions. Airfares should be included only if the comparison uses the same departure airport and booking window; otherwise, the analysis risks attributing flight-price differences to the destination itself.
Travellers should also check the cost of arriving on 30 December versus earlier dates. A slightly longer stay may be worthwhile if the extra night is cheaper, but that possibility must be established through actual rates rather than assumed.
Local Transport and Event Access Matter
Accommodation location can influence both cost and convenience. New York’s Times Square celebration involves crowd-management arrangements and restricted viewing access, making early planning essential. Visitors should consult official event guidance and public transport updates rather than assume that the shortest route will remain accessible throughout the evening.
In Las Vegas, visitors should consider how far their hotel sits from the Strip’s principal festivities. In New Orleans, the French Quarter and Woldenberg Park provide a concentrated celebration area, while Nashville’s Big Bash draws crowds towards its designated downtown event site. Each city requires travellers to assess walking routes, road closures, transport availability and the journey back to their accommodation.
Free public events can reduce ticket expenditure, but they do not eliminate the other costs of a holiday. Dining reservations, paid entertainment, parking and late-night transport can materially alter the final bill. Visitors should also check the current event’s access rules, age restrictions and permitted items before travelling.
Advertisement
Advertisement
For the 2026–27 season, event schedules and local transport arrangements should be checked again as official announcements are published. Historical arrangements can guide planning, but they should not be treated as confirmed instructions for an upcoming celebration.
How the Industry Should Read the Numbers
The four destinations illustrate different ways of converting tourism attention into economic activity. New York benefits from a broad mix of leisure and business travel, while Las Vegas combines resorts, conventions, entertainment and gaming. New Orleans draws on cultural experiences and hospitality, whereas Nashville connects live music with a wider city-break proposition.
These models create different commercial risks. A hotel-heavy market may generate substantial room revenue, while a free public concert may deliver value through dining, transport and surrounding entertainment. Neither model is inherently superior; the outcome depends on overnight demand, spending patterns and the costs of hosting the event.
Las Vegas’s 2025 visitor decline and lower average room rates show why a destination’s reputation cannot substitute for current performance data. Meanwhile, New Orleans’s 2025 spending increase and Nashville’s record event expenditure point to strong tourism activity, but neither result alone predicts the coming holiday’s hotel market.
For travel businesses, the most valuable indicators will be holiday-specific room rates, occupancy, room nights sold and length of stay. For destination marketers, the challenge is to convert event visibility into overnight bookings and additional visitor spending. For travellers, the priority remains simpler: determine whether the celebration, location and length of stay justify the total cost.
Which City Offers the Strongest Holiday Proposition?
No single destination can yet be declared the definitive winner across all five measures. The available evidence establishes the scale of each tourism economy and provides historical hotel-price and event-spending benchmarks, but a complete verdict requires matched accommodation prices and holiday-specific occupancy data for December 2026.
Advertisement
Advertisement
New York remains the natural contender for travellers prioritising the globally recognised countdown. Las Vegas offers extensive resort choice and a concentrated entertainment experience, while New Orleans combines a free riverfront celebration with cultural attractions. Nashville stands out for its live-music identity and documented event-related spending.
For budget-conscious visitors, the most useful strategy is to compare the complete three-night cost, not the advertised room rate alone. Ultimately, the winning destination will be the one that best matches a traveller’s priorities, budget and preferred experience, rather than simply the city with the biggest crowd or highest spending total.
Advertisement
