
New York Destinations Under Fresh Pressure as Canada-US Trade Tensions Reshape Travel

Published
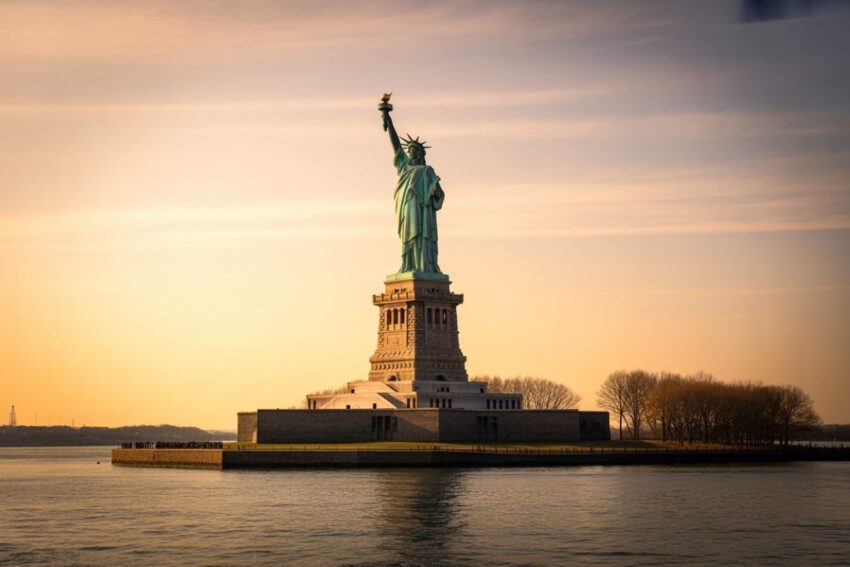
Image generated with Ai
New York Destinations Under Fresh Pressure as Canada-US Trade Tensions Reshape Travel, creating new questions for global visitors. As Canada-US trade tensions reshape travel, New York destinations face fresh pressure from changing visitor patterns, costs and cross-border demand. New York destinations under fresh pressure now include border attractions, scenic regions and major tourism hubs. Meanwhile, Canada-US trade tensions continue to reshape travel choices for Canadian and international travellers. New York destinations under fresh pressure could see further changes as travel behaviour evolves. Therefore, travellers should follow the latest tourism and border developments before booking. Travel And Tour World urges readers to read the entire story for the complete travel picture.
Canadian Visitor Numbers Fall Sharply
New York travellers are entering a changing tourism environment as Canada-US trade tensions affect cross-border movement and business costs.
The New York State Comptroller reported that nearly 3.6 million fewer travellers crossed from Canada into New York in 2025. That represented a 21.2% decline compared with 2024. The reduction was particularly important for communities close to the Canadian border.
For tourists, the figures matter because Canadian visitors support hotels, restaurants, shops and attractions across New York.
Advertisement
Advertisement
Border destinations such as Buffalo and Niagara Falls can be especially sensitive to changes in Canadian travel demand.
Advertisement
Advertisement
New Tariffs Add Economic Uncertainty
Canada has announced additional counter-tariffs beginning September 8, 2026. The measures cover approximately $27.6 billion of US imports and include products connected with steel, dairy, appliances, agricultural equipment, pulp and paper, and electronics.
The new rates will be 15%, 25% or 50%, depending on the applicable US tariff affecting each product.
The CBS6 Albany report identifies construction as one sector facing considerable pressure. Lumber and steel are particularly relevant because higher material costs can influence building and renovation expenses.
Advertisement
Advertisement
For travellers, the impact could eventually appear through tourism infrastructure. Hotel construction, property renovations and commercial developments all depend on predictable material costs.
What Travellers Should Expect
Higher tariffs do not automatically mean every New York hotel or attraction will become more expensive.
Advertisement
Advertisement
However, official Federal Reserve research shows that tariffs have already affected consumer prices. Research published in April 2026 estimated that tariffs implemented through November 2025 increased core goods personal consumption expenditure prices by 3.1% through February 2026. The researchers also found that tariff pass-through had become effectively complete in their sample.
Travellers should therefore compare accommodation and transportation prices before booking.
The trade dispute is also a reminder that New York tourism remains closely connected to Canada. For international visitors, monitoring border requirements, hotel prices and local tourism conditions can help make trips more predictable.
Discover How Canada-US Trade Tensions Could Reshape New York’s Top Tourist Destinations in 2026
The Canada-US trade dispute is becoming increasingly relevant for travellers considering New York, particularly destinations close to the Canadian border. Official New York data shows that 2025 brought a substantial decline in Canadian crossings, while several tourism destinations also recorded weaker visitor numbers.
A critical point for interpreting the figures is that New York does not publish a complete destination-by-destination monthly Canadian visitor series for every city. Therefore, it would be misleading to manufacture monthly visitor totals. The most reliable government evidence combines U.S. Customs and Border Protection border-traveller statistics with New York State park attendance, National Park Service visitation, employment data and state tourism spending figures.
Advertisement
Advertisement
This provides a much stronger picture of which destinations are most exposed to weaker Canadian demand.
Canada-US Trade Tensions: The Key New York Travel Numbers
According to the New York State Office of the Comptroller, almost 3.6 million fewer travellers crossed from Canada into New York during 2025. That represented a 21.2% decline from 2024. Importantly, January was the only month in 2025 when Canadian crossings were higher than the corresponding month of 2024.
The broader U.S. border picture was also weaker. CBP recorded 37.1 million travellers arriving from Canada in 2025, down by approximately 10.3 million, or 21.7%, from 2024. These figures represent travellers presenting themselves at land ports and do not necessarily equal unique tourists or overnight visitors.
| Indicator | Latest official figure | Comparison |
|---|---|---|
| Canadian travellers entering U.S. in 2025 | 37.1 million | Down 10.3 million |
| Canadian crossings into New York | Nearly 3.6 million fewer | -21.2% |
| Overseas visitors to New York | Nearly 176,650 fewer | -3.0% |
| U.S. overseas visitation | 34.3 million | -2.5% |
| New York international visitor spending, 2024 | Nearly $17 billion | Major economic contribution |
| New York international-travel-related private jobs, 2024 | 932,400+ | $45.4 billion in wages |
| Niagara Reservation visitors, 2025 | 8.91 million | -610,100 |
| Niagara Reservation visitors, 2024 | 9.52 million | Baseline |
| New York state-park attendance, 2025 | 86.03 million | -2.35 million |
| New York state-park attendance, 2024 | 88.38 million | Baseline |
| Travel-related employment loss in Western New York | 656 jobs | Jan-Sept 2025 |
The numbers demonstrate why border tourism is especially important. Canadian visitors do not simply contribute to attraction attendance. They also support hotels, restaurants, retail businesses, transport operators and entertainment providers.
1. Niagara Falls: The Destination Facing the Clearest Pressure
Niagara Falls is arguably the clearest destination to watch because it sits directly within the cross-border tourism economy. The Niagara Reservation recorded 8.91 million visits in 2025, compared with approximately 9.52 million in 2024. That represents a decline of more than 610,000 visits, or 6.4%.
Advertisement
Advertisement
The monthly pattern is important, but the official sources currently provide the strongest comparable monthly information at the border level rather than a complete Canadian-only monthly visitor count for Niagara Falls itself. The New York Comptroller confirms that Canadian travel to New York declined in almost every month of 2025, with January the sole exception.
For travellers, Niagara Falls therefore remains highly accessible and attractive, but its tourism economy is unusually sensitive to cross-border demand.
| Niagara Reservation | 2024 | 2025 | Change |
|---|---|---|---|
| Recreational visits | 9.516 million | 8.906 million | -610,100 |
| Percentage change | — | — | -6.4% |
The destination’s exposure is also understandable geographically. Visitors can reach the Niagara region from both sides of the international border, making Canadian travel behaviour particularly important.
2. Buffalo: A Major Western New York Tourism Hub
Buffalo is another destination that could face continued pressure because it is embedded within the Western New York border economy.
The Comptroller’s analysis found that Buffalo’s hotel occupancy remained relatively similar to 2024, but this headline masks a more complicated situation. Hotel-room availability was lower, while occupancy itself declined by nearly 1%.
Advertisement
Advertisement
Western New York also recorded the largest absolute decline in travel-related employment among the border regions examined by the Comptroller. Through September 2025, the region lost 656 travel-related jobs compared with the corresponding period of 2024.
Canalside is particularly significant for visitors. Empire State Development has described it as a year-round attraction that normally welcomes approximately 1.5 million visitors annually.
Buffalo also expanded visitor infrastructure around Canalside. In 2025, the Erie Canal Harbor Development Corporation introduced a seasonal shuttle designed to improve access and handle expected summer visitor traffic.
| Buffalo tourism indicator | Official figure |
|---|---|
| Travel-related employment change, Jan-Sept 2025 | -656 jobs |
| Hotel occupancy change | Nearly -1% |
| Canalside normal annual visitation | Nearly 1.5 million |
| 2025 Canalside seasonal shuttle | Introduced |
For global tourists, Buffalo offers an important alternative to a traditional New York City itinerary. Its waterfront, architecture, food culture and proximity to Niagara Falls make it suitable for a multi-destination trip.
3. The Adirondacks and North Country: A Border Region to Watch
The Adirondacks and wider North Country are also vulnerable because of their proximity to Canada.
Advertisement
Advertisement
The Comptroller reported that North Country travel-related employment declined 1.9% through September 2025. This was the largest percentage decline among the selected border regions in its analysis.
North Country state parks also recorded a modest decline. Attendance fell by 19,060 visits, equivalent to 0.9%, during 2025.
| North Country indicator | 2025 result |
|---|---|
| Travel-related employment change | -1.9% |
| State park attendance change | -19,060 |
| Percentage change in state park attendance | -0.9% |
The region includes outdoor experiences that appeal strongly to Canadian and international travellers. Hiking, lakes, scenic drives and winter activities give the region a seasonal tourism profile.
The state has also invested in traveller services. Empire State Development previously reported that the Adirondacks Welcome Center reached one million visitors, highlighting the importance of road-based tourism in the region.
4. Albany and the Capital Region: Indirect Pressure
Albany is farther from the Canadian border than Buffalo or Niagara Falls, but it can still feel the effects of weaker Canadian demand.
Advertisement
Advertisement
The Capital Region has a broad tourism economy involving museums, government-related travel, events, hotels and access to the Adirondacks and Hudson Valley.
Official data cited by the Comptroller shows that hotel occupancy declined in Albany, Warren and Schenectady counties during the first half of 2025. Saratoga County was broadly flat.
This creates an important distinction for travellers.
Albany’s exposure is not solely dependent on Canadian visitors. However, weaker regional travel can affect accommodation demand, particularly when Canadian road travellers reduce longer trips into upstate New York.
| Capital Region indicator | First half 2025 |
|---|---|
| Albany County hotel occupancy | Down |
| Warren County hotel occupancy | Down |
| Schenectady County hotel occupancy | Down |
| Saratoga County hotel occupancy | Flat |
For international travellers, Albany can still function as a strategic base for exploring historic attractions, Saratoga Springs and surrounding scenic areas.
Advertisement
Advertisement
5. Saratoga Springs: A More Mixed Picture
Saratoga Springs provides a useful contrast because its tourism performance has been more resilient than some border communities.
The Comptroller reported that hotel occupancy in Saratoga County was flat during the first half of 2025. However, Saratoga Springs State Park recorded approximately 3.72 million visits in 2025, compared with 3.93 million in 2024. That equals a reduction of roughly 210,400 visits, or 5.3%.
| Saratoga Springs State Park | 2024 | 2025 | Change |
|---|---|---|---|
| Visits | 3.934 million | 3.724 million | -210,400 |
| Percentage change | — | — | -5.3% |
This suggests that a destination can maintain comparatively stable accommodation demand while still experiencing changes in attraction visitation.
For travellers, Saratoga remains an attractive stop for heritage, horse-racing culture, wellness and outdoor recreation.
6. New York City: Large Numbers but Lower Direct Border Exposure
New York City is less directly dependent on Canadian land crossings than destinations in Western and Northern New York.
Advertisement
Advertisement
Nevertheless, the city is part of the same statewide international tourism system.
New York recorded nearly 176,650 fewer overseas arrivals in 2025, representing a 3% decline. The Comptroller also reported that New York City could see approximately 2.9 million fewer visitors in 2025, with visitor spending projected to fall by around $6 billion.
National Park Service figures provide another indication of changing visitor behaviour. Through the relevant 2025 reporting period, the Statue of Liberty recorded approximately 3.54 million recreational visits, compared with 3.72 million in 2024. That was a reduction of approximately 183,800 visits, or 4.9%.
| New York City indicator | 2024 | 2025 | Change |
|---|---|---|---|
| Statue of Liberty visits | 3.722 million | 3.538 million | -183,800 |
| Percentage change | — | — | -4.9% |
| Projected city visitor reduction | — | 2.9 million | — |
| Projected spending reduction | — | $6 billion | — |
New York City therefore faces a broader international-tourism challenge rather than the same direct border exposure experienced by Niagara Falls or Buffalo.
7. New York State’s Wider Tourism Economy
The scale of the state’s tourism economy makes these changes significant.
Advertisement
Advertisement
Empire State Development reported that New York welcomed more than 291 million visitors in a recent record year, generating an estimated $123 billion economic impact.
The state’s 2024 visitor-spending data also provides useful context. Total visitor spending reached $93.99 billion. Canadian visitors accounted for approximately $1.70 billion, compared with $1.76 billion in 2023. Overseas visitors generated approximately $18.18 billion.
| New York visitor spending | 2023 | 2024 | Change |
|---|---|---|---|
| Total | $88.10bn | $93.99bn | +6.7% |
| Canada | $1.76bn | $1.70bn | -3.5% |
| Overseas | $15.16bn | $18.18bn | +19.9% |
| Domestic | $71.17bn | $74.10bn | +4.1% |
| Lodging | $28.64bn | $31.00bn | +8.2% |
| Food & beverages | $22.60bn | $24.38bn | +7.9% |
| Transportation | $12.81bn | $13.39bn | +4.6% |
| Recreation & entertainment | $8.86bn | $9.35bn | +5.5% |
These figures show that New York’s tourism economy remained substantial even as Canadian spending weakened.
Monthly Canada-to-New York Picture: What the Official Data Actually Shows
A key issue for publishers is avoiding false precision.
The New York Comptroller’s official analysis contains a month-by-month chart of Canadian travellers entering New York during 2024 and 2025. It establishes that 2025 was weaker than 2024 in every month except January.
Advertisement
Advertisement
However, the accessible official text does not reproduce every monthly numerical value from that chart. Consequently, publishing invented January-to-December totals would not meet a high standard of factual accuracy.
| Month | 2025 Canadian travel compared with 2024 | Interpretation |
|---|---|---|
| January | Higher | Only month showing an increase |
| February | Lower | Decline |
| March | Lower | Decline |
| April | Lower | Decline |
| May | Lower | Decline |
| June | Lower | Decline |
| July | Lower | Decline |
| August | Lower | Decline |
| September | Lower | Decline |
| October | Lower | Decline |
| November | Lower | Decline |
| December | Lower | Decline |
The annual result was a 21.2% decline, equivalent to nearly 3.6 million fewer Canadian travellers entering New York.
Tourism Employment Shows Why the Destinations Matter
Tourism pressure is not limited to visitor attractions.
In 2024, New York had more than 932,400 private-sector jobs connected with international travel. Those positions generated more than $45.4 billion in wages. Approximately 74.2% of employment was in accommodation and food services.
Through September 2025, average employment in travel-related industries increased by only 1,782 jobs, or 0.2%, compared with the same period in 2024. Accommodation and food-service employment itself declined by 798 jobs, or 0.1%.
Advertisement
Advertisement
| Employment indicator | Latest figure |
|---|---|
| International-travel-related private jobs, 2024 | 932,400+ |
| Wages generated | $45.4bn+ |
| Accommodation and food-service employment share | 74.2% |
| Travel-related employment growth, Jan-Sept 2025 | +1,782 |
| Travel-related employment growth rate | +0.2% |
| Accommodation and food-service jobs | -798 |
| Western New York travel-related jobs | -656 |
| North Country travel-related employment | -1.9% |
What This Means for Global Travellers
The Canada-US trade tensions do not mean that New York’s attractions are disappearing or that international travellers should avoid the state.
Instead, the data points to a changing tourism market.
Niagara Falls and Buffalo face the most obvious border-related exposure. The Adirondacks and North Country also deserve close attention because of their proximity to Canada. Albany and Saratoga are more diversified but have still experienced changes in accommodation or attraction demand.
For travellers, this environment can create both challenges and opportunities.
Lower demand can sometimes mean greater accommodation availability outside major events and peak weekends. Meanwhile, destinations may strengthen visitor programmes to attract travellers from other domestic and international markets.
Advertisement
Advertisement
The most important lesson is to monitor official border guidance, accommodation prices, attraction schedules and transportation information before travelling.
New York’s tourism economy remains enormous. However, the 2025 data makes clear that international travel patterns are changing, and destinations closest to Canada are feeling the impact most visibly.
Conclusion
New York’s tourism landscape is changing as Canada-US trade tensions reshape travel patterns across the state. Border destinations such as Niagara Falls, Buffalo and the Adirondacks could remain particularly sensitive to changes in Canadian visitation. However, New York continues to offer diverse experiences for travellers worldwide. Therefore, visitors should monitor border updates, accommodation prices and local tourism conditions before planning their journeys. At the same time, changing demand could create opportunities for travellers seeking greater flexibility and competitive deals. Travel And Tour World urges travellers to stay informed, plan carefully and explore New York beyond its busiest attractions as the travel environment continues to evolve.
Advertisement
