
Alabama And Arizona Lead A Fierce Tourism Battle As Record Spending Creates America’s New Travel Kings

Published
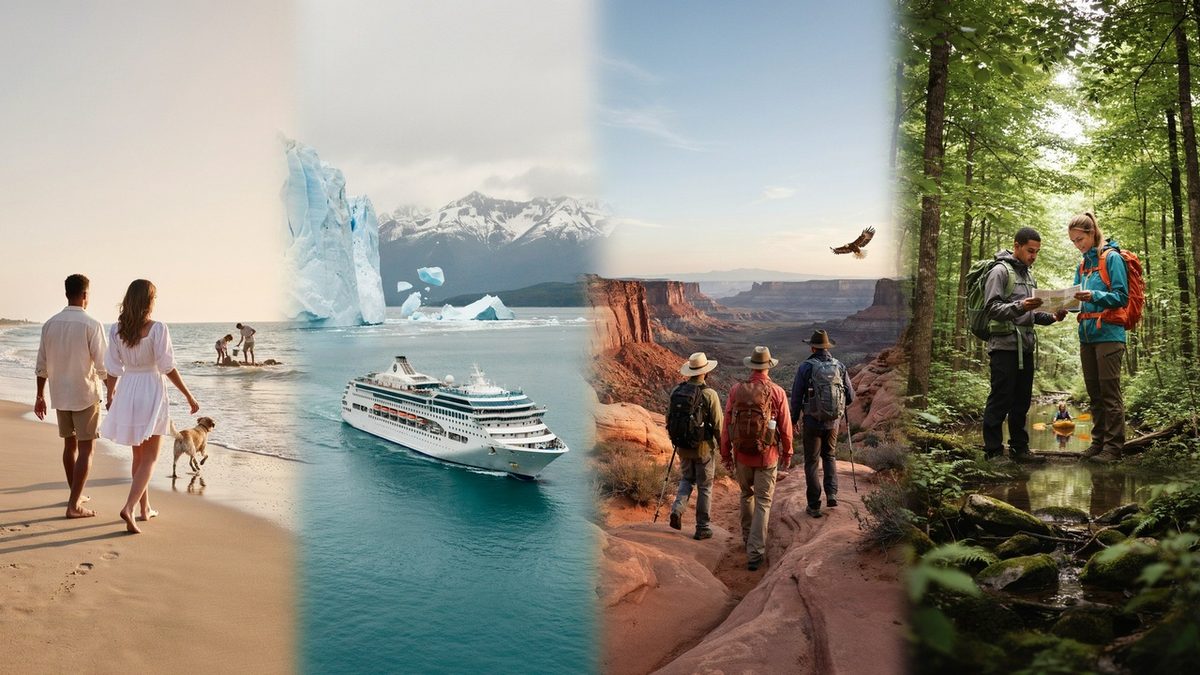
A comparative analysis of official state tourism data
Four states beginning with “A” — Alabama, Alaska, Arizona, and Arkansas — each posted historic or near-historic tourism performance in the 2025 reporting cycle, according to their respective state tourism offices and independent economic-impact studies (Tourism Economics, McKinley Research Group, and Dean Runyan Associates). Three of the four (Alabama, Arizona’s job count, and Arkansas) set outright visitation or employment records. Alaska posted its highest-ever 12-month visitor count on record for the May 2024–April 2025 season. The one common thread across all four states: visitors are increasingly domestic, increasingly experience-driven, and — in Arizona and Arkansas — spending patterns are shifting even where raw arrival numbers grow.
Alabama — Fifth Consecutive Record Year
- 29.2 million visitors, a record for the fifth straight year
- $24.9 billion in visitor spending — an all-time high, up 4% year-over-year
- 255,780 jobs supported by tourism (176,738 of them direct)
- $1.45 billion in state and local tax revenue generated
- Tourism now accounts for roughly 6.5% of Alabama’s economy
- Without tourism tax revenue, the average Alabama household would owe an estimated $725 more in taxes
Where the growth is concentrated:
- The Gulf Coast region (anchored by Baldwin County’s beaches) remains the top draw, generating $10.1 billion — 41% of all statewide tourism spending, up 5% from 2024
- Baldwin, Jefferson, Madison, Mobile, and Montgomery counties together account for 72.5% of all visitors statewide
- North Alabama (Huntsville/Madison County) generated $4.9 billion, with Huntsville’s sports-tourism segment alone topping $62 million in economic impact — a fourth consecutive record year
- Spending has climbed in 14 of the last 15 years (the only dip was the 2020 pandemic year), and is up 264% since 2003
- Restaurants and bars account for the largest job share (53%), followed by lodging (22%) and entertainment (12–14%)
Growth driver: A sustained, decade-long marketing push around civil rights heritage sites, Gulf Coast beaches, and emerging destinations like Huntsville, alongside steady lodging-tax reinvestment into the state’s General Fund.
Advertisement
Advertisement
Alaska — Record Visitation Driven by a Booming Cruise Sector
Headline numbers (Alaska Travel Industry Association / McKinley Research Group):
- 3.08 million out-of-state visitors for the 12-month period May 2024–April 2025 — a new record, edging past the prior year’s 3.05 million
- 58% of all visitors arrived by cruise ship
- Cruise passenger volume has more than tripled (+350%) since 1995
- Over the 2014–2024 decade, overall Alaska tourism grew 63% (1.66M → 2.7M visitors), while the cruise segment specifically grew 84%
- Most recent full economic-impact figures (2022–23 season, the latest fully audited period): $3.9 billion in direct visitor spending and $5.6 billion in total economic impact, supporting roughly 48,000 Alaskan jobs
- Alaska national park visitation reached 3.47 million recreation visits (up 29% over the decade), generating $2.3 billion in economic value
2026 outlook: AAA projects a record 21.7 million Americans will cruise in 2026 nationally, with Alaska ranking among the top destinations alongside the Caribbean. Juneau alone processed an estimated 1.7 million cruise passengers in 2025 (a 31.6% share of all Alaska cruise arrivals). However, Juneau’s passenger count actually dipped 1% in 2025 amid local overtourism concerns — the city and the Cruise Lines International Association agreed to a voluntary cap of five ships and 16,000 passengers per day (12,000 on Saturdays) starting in 2026.
Advertisement
Advertisement
Growth driver: Expedition-style and premium cruising, larger vessel capacity (Royal Caribbean’s Icon-class ships carry up to 7,600 passengers), and major port expansions — including a $137 million Seward dock expansion completing by spring 2026.
Arizona — Record Jobs Even as Overnight Volume Softens
Headline numbers (Arizona Office of Tourism, FY25 / 2025):
- 326,359 total jobs supported by tourism in 2025 — a record — up 0.6% from 324,136 in 2024
- 195,190 direct tourism jobs, up 0.7% year-over-year
- 41.16 million domestic overnight visitors (FY25); for comparison, 2024 brought $29.7 billion in visitor spending on 20.8 million+ visitors under a different (annual calendar) measurement
- Notably, employment hit a record even as overnight visitor volume softened — a sign of visitors spending more per trip rather than simply arriving in greater numbers
- Restaurant/food-service spending: $6.8 billion (+1.8%); arts, entertainment & recreation: $3.0 billion (+3.4%); retail: $839 million (+3.2%); air travel spending: +7.7%
- Accommodation spending actually fell 1%, and local transportation fell 1.4% — reinforcing the “spend on experiences, not just beds” trend
Visitor origin (most recent official breakdown):
- Domestic vs. international split (2025): 88% domestic / 12% international
- Top domestic feeder states: California, New York, Texas, Florida, and Illinois
- Top international source markets (most recent official AOT ranking): Mexico (the clear #1 source), followed by Canada, the United Kingdom, Germany, France, India, and Italy
- Canadian visitation — historically one of Arizona’s largest international segments (822,500 visitors and $775 million in spending in 2023) — was projected to decline 20–30% in 2025 amid a weak Canadian dollar and new extended-stay registration requirements, a headwind Arizona has partly offset with growth in Mexican and other international travel
Metro spotlight — Phoenix: The Phoenix metro alone welcomed 47.7 million visitors in 2025 (roughly flat vs. 2024), spending a record $13.4 billion directly ($23.6 billion counting indirect impact) and generating $3.5 billion in government revenue. International travelers made up only 3.6% of Phoenix visitors, but per-visitor international spending rose 1.6%.
Growth driver: Major sporting and entertainment events (Waste Management Open, NCAA Women’s Final Four), continued resort/hospitality investment, and a state tourism strategy that AOT estimates converts each 1% rise in visitation into roughly $300 million in added spending.
Arkansas — Record Visitor Count, but a Rare Spending Dip
Headline numbers (Arkansas Department of Parks, Heritage and Tourism / Tourism Economics, 2025 Economic Impact Report):
Advertisement
Advertisement
- 54.3 million visitors — the highest ever recorded, up 4.4% from 2024
- $10.2 billion in direct visitor spending — down 0.9% from 2024’s $10.3 billion, making Arkansas the one state of the four where record arrivals did not translate into record spending
- $17.4 billion total economic impact (flat versus 2024)
- 71,860 direct jobs supported by tourism
- Record FY26 tourism tax collections of ~$26.9 million (2% tourism tax)
- Reduces the average Arkansas household’s annual tax burden by an estimated $919
Why spending fell even as visitor counts rose: State officials attribute the dip to a shift toward shorter, in-state trips, which involve less transportation spending. Notably:
- 55% of Arkansas’s 2025 visitors came from inside the state itself — by far the highest in-state share among the four states profiled
- The average visitor was 47 years old; millennials and Gen Z made up 49% of all visitors
- Spending breakdown: food & beverage (30%, ~$3.0B at restaurants and local businesses), transportation (28%), lodging (17%)
Growth driver: Heavy state investment in outdoor recreation — new Natural State Initiative Economic Opportunity Zones around Pinnacle Mountain, Petit Jean, Delta Heritage Trail, and Queen Wilhelmina state parks; Arkansas’s first lift-served mountain bike parks (Bella Vista and Mena); and a push to make Blanchard Springs Caverns the state’s 53rd state park.
Head-to-Head Comparison Table
| Metric | Alabama | Alaska | Arizona | Arkansas |
|---|---|---|---|---|
| Visitors | 29.2M (record, 5th straight yr) | 3.08M out-of-state (record, May’24–Apr’25) | 41.16M domestic overnight (FY25) | 54.3M (record, +4.4%) |
| Direct spending | $24.9B (+4%) | ~$3.9B (latest full-year figure, 2022–23) | $29.7B (2024, record) | $10.2B (−0.9%) |
| Total economic impact | — | $5.6B (2022–23) | — | $17.4B (flat) |
| Jobs supported | 255,780 | ~48,000 (2023) | 326,359 (record) | 71,860 |
| Dominant visitor type | Domestic road-trip / beach | Cruise (58% of arrivals) | Domestic + resort/event traveler | In-state / regional |
| Top feeder markets | Not broken out; Southeast US regional | Lower-48 US, cruise-line sourced | CA, NY, TX, FL, IL (domestic); Mexico, Canada, UK, Germany, France (international) | 55% from within Arkansas itself |
| Standout 2025 trend | Gulf Coast dominance (41% of spend) | Record cruise volume + Juneau overtourism caps | Record jobs despite flat/softer arrivals | Record arrivals despite spending dip |
Note on comparability: each state tourism office uses different methodologies (visitor counts vs. overnight counts, calendar year vs. 12-month rolling season, direct spending vs. total economic impact), so figures should be read within-state over time rather than as a strict apples-to-apples ranking.
Key Takeaways
- Volume and value are decoupling. Arizona hit a record jobs number and Arkansas hit a record visitor count in 2025 — but in both states, per-visitor or total spending either flattened or fell. The “surge” in 2025 was as much about more frequent, shorter, closer-to-home trips as it was about big-ticket travel.
- Alabama is the outlier in strength — it is the only one of the four posting simultaneous records in visitor count, spending, and job growth for a fifth consecutive year, led by sustained Gulf Coast demand.
- Alaska’s growth is almost entirely cruise-driven, and is now running into physical capacity limits — Juneau’s new passenger caps in 2026 signal that raw visitor growth in Alaska’s most popular port may plateau even as the broader cruise market keeps expanding nationally.
- International travel is a wildcard, especially for Arizona. A projected 20–30% pullback in Canadian visitation (driven by currency and new entry-registration rules) is a headwind uniquely facing Arizona among these four largely domestic-tourism states.
- Arkansas’s in-state loyalty (55% of visitors) is unusual and reflects a state economy leaning into outdoor recreation infrastructure rather than long-haul or international tourism marketing.
Advertisement
