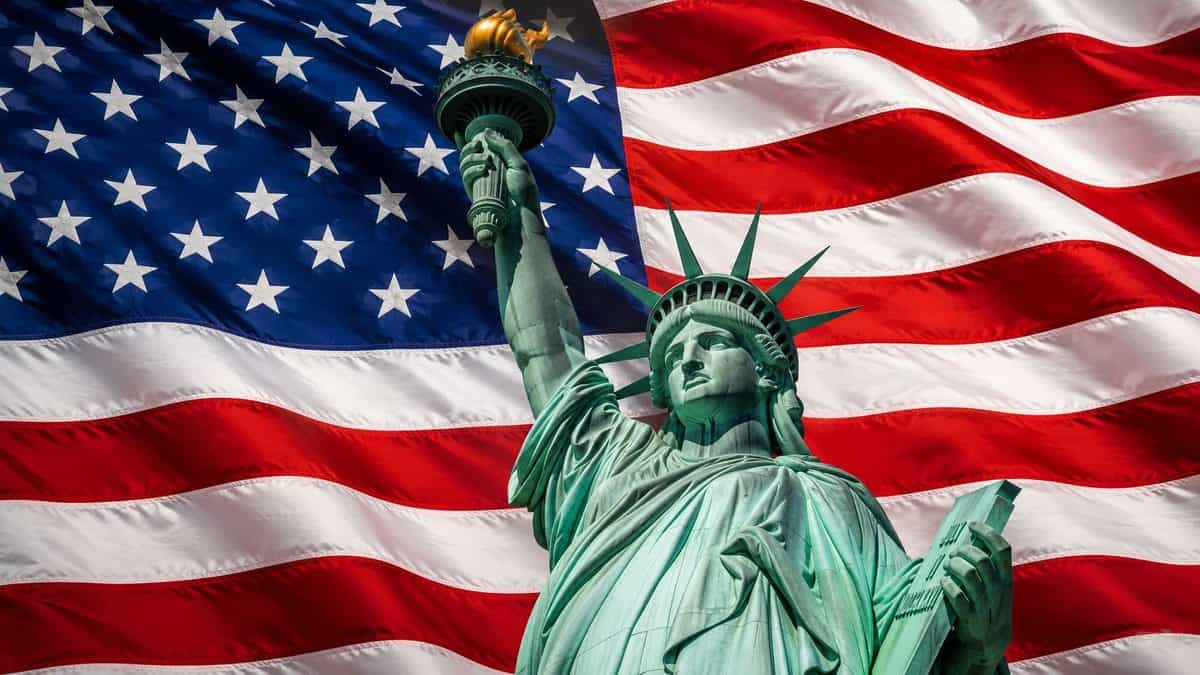
Image generated with Ai
Missouri joins Washington and others in an uncertain travel trend as US tourism roars in June-July but fails to sustain momentum in later 2026. The sharpest acceleration coincided with the FIFA World Cup, staged from 11 June to 19 July, when Kansas City, Seattle, Boston, Dallas and Houston served as US host markets. Missouri’s June-July average YoY growth surged to 25.24%, Washington reached 10.35%, Massachusetts 3.73% and Texas 2.87%. Projected August growth then moderates, suggesting exceptional tournament-period travel demand, combined with the normal summer peak, could fade as football-driven visitor flows recede.
Missouri shows the strongest World Cup-period acceleration among the four states. June arrivals rose 30.03% year on year, from 29,300 in 2025 to 38,100 in 2026, while July increased 20.45%, from 30,800 to 37,100. This produced an exceptional 25.24% average YoY increase during June and July, compared with only 1.74% outside those two months. The timing is significant because Missouri had recorded declines in February and March before improving in May and then surging during the tournament period. Kansas City’s role as a FIFA World Cup host market gives a strong logical basis for linking part of this acceleration to football-driven tourism.
| Period | Average YoY Growth |
|---|---|
| Jan–May + Projected August | +1.74% |
| June–July | +25.24% |
| Growth Acceleration | +23.50 percentage points |
The tourism impact would have extended beyond match ticket holders. International supporters, domestic spectators, media crews, sponsors, event staff and travelling hospitality groups all create additional hotel nights, restaurant spending and transport demand. Kansas City’s position as a major host market could also have encouraged visitors to stay before and after matches rather than make single-day trips. This type of extended-stay behaviour is particularly valuable because it spreads tourism expenditure across attractions, dining, retail and surrounding communities.
| Month | 2026 Tourist Arrivals | 2025 Tourist Arrivals | YoY Change |
|---|---|---|---|
| January | 27.3K | 25.0K | +9.20% |
| February | 23.2K | 26.7K | -13.11% |
| March | 30.1K | 34.1K | -11.73% |
| April | 23.0K | 22.0K | +4.55% |
| May | 25.9K | 22.7K | +14.10% |
| June | 38.1K | 29.3K | +30.03% |
| July | 37.1K | 30.8K | +20.45% |
| August Projected | 19.8K | 18.4K | +7.40% |
The projected August growth rate of 7.40% is still positive but substantially below the June–July average. That suggests Missouri could experience a post-World Cup normalisation rather than an outright tourism decline. Once match-driven travel, media activity and event-related accommodation demand disappear, visitor growth would naturally return closer to the state’s underlying trend. The sharp difference between 25.24% during June–July and 7.40% in projected August strengthens the case that the World Cup period created an unusually concentrated tourism uplift.
Advertisement
Advertisement
Washington offers one of the clearest examples of a tourism market changing direction during the World Cup period. Arrivals fell 11.60% in January, 4.48% in February and 1.40% in March, before recovering in April and May. The strongest gains then arrived during June and July, when average YoY growth reached 10.35%. June alone increased 12.36%, while July rose 8.33%. Compared with an almost flat 0.02% average across January–May and projected August, the mid-year acceleration is difficult to ignore.Period Average YoY Growth Jan–May + Projected August +0.02% June–July +10.35% Growth Acceleration +10.33 percentage points
Seattle’s host-city role provides a credible mechanism for this shift. The city is a major international gateway with substantial hotel infrastructure and established leisure demand. World Cup visitors arriving for matches could also extend their stay across the wider Pacific Northwest, supporting tourism beyond the immediate stadium area. This matters because mega-event tourism often disperses through regional airports, rail, road trips, attractions and accommodation markets rather than remaining concentrated in the host city.
| Month | 2026 Tourist Arrivals | 2025 Tourist Arrivals | YoY Change |
|---|---|---|---|
| January | 884K | 1.0M | -11.60% |
| February | 789K | 826K | -4.48% |
| March | 915K | 928K | -1.40% |
| April | 925K | 870K | +6.32% |
| May | 1.0M | 922K | +8.46% |
| June | 1.1M | 979K | +12.36% |
| July | 1.3M | 1.2M | +8.33% |
| August Projected | 1.34M | 1.3M | +2.80% |
Washington’s projected August growth slows to 2.80%, well below June and July. This moderation supports the idea that part of the summer surge was temporary and event-related. Once tournament travel fades, growth returns closer to ordinary seasonal levels. Yet the projected August figure remains positive, suggesting the state could retain some momentum after the event rather than immediately reverting to the declines seen at the start of 2026.
Massachusetts recorded a more moderate but still meaningful improvement during the World Cup period. The state had struggled through February, March and April, with YoY declines of 0.90%, 3.26% and 4.30% respectively. Growth returned in May, then strengthened to 4.99% in June and remained positive at 2.47% in July. This produced a June–July average of 3.73%, compared with an average decline of 0.26% outside those months.
Advertisement
Advertisement
| Period | Average YoY Growth |
|---|---|
| Jan–May + Projected August | -0.26% |
| June–July | +3.73% |
| Growth Acceleration | +3.99 percentage points |
The Boston-area host market gives this improvement an additional tourism dimension. Massachusetts already has a mature visitor economy, which means even substantial additional arrivals may translate into relatively modest percentage increases. However, football visitors could generate longer stays because Boston offers historical attractions, museums, waterfront experiences and easy access to wider New England destinations. In this type of market, the value of the World Cup is not simply extra arrivals but also additional hotel nights and wider visitor spending.
| Month | 2026 Tourist Arrivals | 2025 Tourist Arrivals | YoY Change |
|---|---|---|---|
| January | 290K | 281K | +3.20% |
| February | 221K | 223K | -0.90% |
| March | 297K | 307K | -3.26% |
| April | 334K | 349K | -4.30% |
| May | 370K | 360K | +2.78% |
| June | 400K | 381K | +4.99% |
| July | 457K | 446K | +2.47% |
| August Projected | 459K | 455K | +0.94% |
The projected August increase of only 0.94% points to a clear cooling after the June–July period. This suggests the World Cup may have provided a temporary lift to a market that had shown weakness earlier in the year. The post-event pattern looks less like a collapse and more like a return towards the state’s underlying trend once football-related travel disappears.
Texas displays a different pattern because its tourism market was already growing before the tournament. Arrivals increased 4.00% in February and 5.81% in March, while May was also positive. During June and July, growth remained healthy at 2.41% and 3.33%, producing a 2.87% average. This was only slightly higher than the 2.44% average outside the World Cup period, suggesting the tournament reinforced an existing growth cycle rather than triggering a dramatic turnaround.Period Average YoY Growth Jan–May + Projected August +2.44% June–July +2.87% Growth Acceleration +0.43 percentage points
The state’s large tourism base is an important reason. Texas handled close to nine million arrivals in several months, so even sizeable additional World Cup traffic produces a relatively small percentage change. Dallas and Houston also provided major host-market connections, allowing tournament demand to spread across multiple metropolitan areas. International football visitors could combine matches with food, entertainment, shopping and road travel, while large airports could capture passengers moving between several World Cup cities.
| Month | 2026 Tourist Arrivals | 2025 Tourist Arrivals | YoY Change |
|---|---|---|---|
| January | 8.7M | 8.6M | +1.16% |
| February | 7.8M | 7.5M | +4.00% |
| March | 9.1M | 8.6M | +5.81% |
| April | 8.6M | 8.7M | -1.15% |
| May | 9.0M | 8.8M | +2.27% |
| June | 8.5M | 8.3M | +2.41% |
| July | 9.3M | 9.0M | +3.33% |
| August Projected | 9.33M | 9.1M | +2.52% |
Texas is also the least affected by the projected post-World Cup slowdown. August is estimated to remain 2.52% above 2025, only marginally below the 2.87% June–July average. This suggests the World Cup acted as an additional demand layer rather than the main engine of tourism growth. Strong domestic travel, large aviation hubs, business demand and multiple major cities appear capable of sustaining momentum even after tournament-related visitor flows subside.
The comparison shows that Missouri experienced by far the strongest World Cup-period acceleration, followed by Washington. Massachusetts moved from an underlying negative trend into clear positive growth, while Texas recorded the most stable performance. The projected August figures then show a common post-event pattern: growth moderates once the tournament period passes, although the severity of that slowdown varies sharply by state.State Jan–May + Projected Aug Avg YoY June–July Avg YoY World Cup-Period Acceleration Missouri +1.74% +25.24% +23.50 pp Washington +0.02% +10.35% +10.33 pp Massachusetts -0.26% +3.73% +3.99 pp Texas +2.44% +2.87% +0.43 pp
For editorial accuracy, the June–July gains should be described as tourism growth coinciding with the FIFA World Cup period, rather than being attributed entirely to the tournament. Summer holidays, aviation capacity, business travel, weather and normal seasonal demand would also have influenced these figures. The strongest logic lies in the unusual change in momentum during June and July, particularly in Missouri and Washington, followed by a projected moderation once the World Cup peak ends.
Missouri joins Washington and others in an uncertain travel trend as US tourism roars in June-July but fails to sustain momentum in later 2026, as World Cup-driven demand fades and tourist arrival growth cools.
In conclusion, Missouri joins Washington and others in an uncertain travel trend as US tourism roars in June-July but fails to sustain momentum in later 2026. The strong summer acceleration coincided with the FIFA World Cup period and peak seasonal travel, bringing increased visitor demand to host markets. However, projected August growth slows considerably, particularly in Missouri, Washington and Massachusetts. This moderation suggests that tournament-related travel provided an exceptional but temporary boost, while Texas shows greater stability. The emerging pattern highlights how major sporting events can rapidly accelerate tourism before visitor growth returns closer to underlying market trends.
Advertisement
Advertisement
Advertisement













Friday, September 4, 2026

Friday, September 4, 2026
Friday, September 4, 2026

Thursday, September 3, 2026

Wednesday, September 2, 2026

Friday, September 4, 2026
Friday, September 4, 2026