
US Tourism Showdown 2026: Montana And Nebraska Reveal Powerful Travel Growth Shift

Published
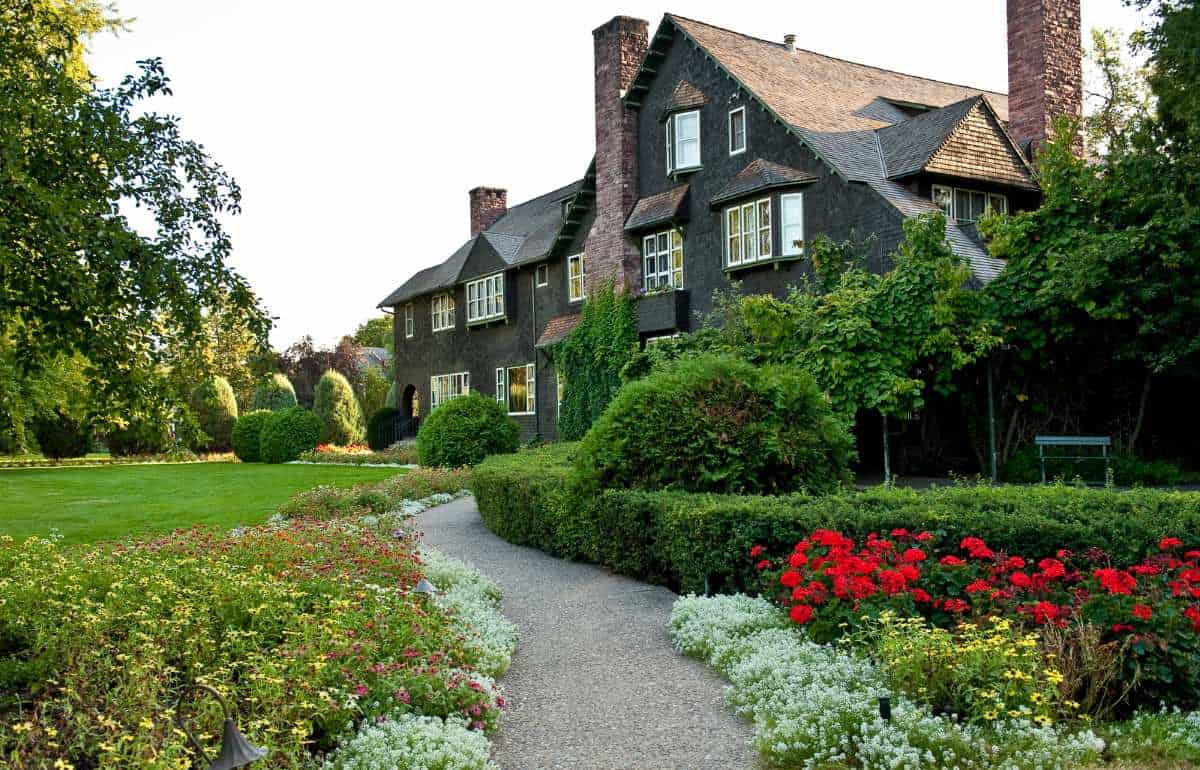
(Image Credit- mt.gov)
A data-backed comparative analysis of 2025–2026 U.S. travel trends reveals a decisive shift from post-pandemic volume surges toward high-yield, value-driven visitor economies across premier adventure, entertainment, and ecotourism corridors.
The American tourism landscape is undergoing a structural recalibration across 2025 and 2026, pivoting from raw post-pandemic foot traffic toward high-yield, sustainable economic growth. As travelers adapt to shifting travel costs and search for less congested destinations, states are aggressively cultivating shoulder-season travel, business conventions, and decentralized rural exploration.
From neon entertainment capitals and iconic national park gateways to tranquil prairie flyways and historic New England alpine routes, destinations are adapting their infrastructure to maximize direct visitor spending.
Advertisement
Advertisement
This comparative analysis examines shifting arrivals, economic footprints, primary feeder markets, and core traveler motivations shaping regional tourism.
Advertisement
Advertisement
| State | Est. Visitors (2025–2026) | Direct Spend (2025–2026) | Primary Feeder Markets | Dominant Draw & Travel Drivers | Key Strategic Evolution |
| Montana | 13.2M → ~13.4M | $5.6B → ~$5.8B | WA, ID, ND, CA, TX, Canada | Glacier/Yellowstone, fly fishing, skiing, wilderness solitude | Expanding shoulder seasons and regional air routes |
| Nebraska | N/A (Statewide road leisure) | $4.55B → ~$4.78B | IA, KS, MO, SD, CO, MN | Sandhill crane migration, Omaha Zoo, College World Series | Dispersing spending to rural counties via ecotourism |
| Nevada | 38.5M → ~40.5M (Las Vegas) | $15.8B+ (Gaming revenue record) | Southern CA, AZ, UT, TX, International | Strip nightlife/casinos, mega conventions, sports tourism | Shifting from mid-tier volume to elite per-capita spend |
| New Hampshire | 14.1M → ~14.4M | $7.2B → ~$7.5B | MA, CT, NY, ME, Atlantic Canada | White Mountains, Lakes Region, foliage, tax-free retail | Dispersing crowds from peaks via sustainable recreation |
Montana Tourism Dynamics: A 2025–2026 Comparative Overview
Montana’s tourism sector is redefining its economic blueprint across 2025 and 2026. Rather than chasing sheer volume, the state has shifted from raw post-pandemic foot traffic toward high-yield, value-driven recreation that safeguards its wild landscapes.
Comparative Shift: 2025 vs. 2026
In 2025, Montana recorded approximately 13.2 million non-resident visitors, marking a modest 4% dip from 2024’s historic peak. Despite the headcount softening, economic contributions set all-time records: out-of-state visitors injected $5.6 billion into local economies, directly supporting over 52,000 jobs and saving the average Montana household more than $740 in state and local taxes. Fuel, dining, and lodging made up the vast majority of expenditures, led heavily by visits to Glacier Country ($1.79 billion) and Yellowstone Country ($1.34 billion).
By 2026, visitation stabilized around 13.4 million non-resident arrivals, with total expenditures projected to reach $5.8 billion. A notable change between the two years is the distribution of visitors across seasons and regions:
- Shoulder-Season Expansion: While summer (July to September) traditionally accounts for 46% of all arrivals, 2026 has witnessed faster growth in autumn and late spring travel, driven by remote workers and visitors dodging peak-season vehicle reservations.
- Flight Infrastructure vs. Road Trips: Personal vehicles accounted for 74% of arrivals in 2025. In 2026, regional airport expansions in Bozeman, Missoula, and Kalispell expanded direct flight capacity, boosting air arrivals beyond the 3.3 million recorded previously.
- Park Management Impacts: Glacier’s vehicle reservation system and Yellowstone’s infrastructure modernization pushed travelers outward into surrounding state parks, which welcomed over 3.4 million visits.
| Metric / Indicator | 2025 Recorded Data | 2026 Projections & Trends |
| Total Non-Resident Visitors | ~13.2 million | ~13.4 million |
| Direct Traveler Spending | $5.6 billion | ~$5.8 billion |
| Glacier & Yellowstone Share | ~7.9 million combined | ~8.0 million combined |
| Top Transport Mode | Personal Vehicle (74%) | Vehicle (71%) / Air Travel (29%) |
| Average Length of Stay | 5.2 nights (6.2 summer) | 5.4 nights |
Who Visits Montana Most?
Geographically, regional neighbors generate roughly one-third of all out-of-state visits:
- Top Feeder States: Washington, Idaho, and North Dakota lead regional arrivals, alongside heavy domestic volumes from California, Texas, Utah, and Minnesota.
- International Travelers: Canadian cross-border traffic accounts for roughly 6% to 7% of total visitors, with Albertans entering via northern border crossings.
- Key Demographics: The average traveler is 57 to 58 years old, traveling in parties of two. Concurrently, younger demographics (ages 25–40) are increasing through solo road-tripping, van life, and adventure tourism.
Why They Come
1. Pristine Public Lands and National Parks
Advertisement
Advertisement
Glacier and Yellowstone remain Montana’s crown jewels. Surveys by the Institute for Tourism and Recreation Research (ITRR) confirm that over 71% of travelers come specifically for mountains and forests, 50% for open spaces, and 49% for rivers and lakes.
2. World-Class Outdoor Recreation
Montana ranks third nationally in outdoor recreation GDP share. Travelers come for blue-ribbon fly fishing on the Madison and Gallatin rivers, backcountry hiking, big-game hunting, and winter skiing at resorts like Big Sky and Whitefish.
3. Western Culture and Solitude
Beyond recreation, visitors seek heritage and open space. The cultural resurgence of Western lifestyle aesthetics has spurred demand for working-ranch retreats, historic mining towns, and local “Made in Montana” products. Travelers consistently cite escaping urban congestion as their primary psychological draw.
Advertisement
Advertisement
Nebraska Tourism Evolution: A 2025–2026 Comparative Analysis
Nebraska’s tourism industry continues to expand beyond its traditional flyover label, cementing its role as the state’s third-largest economic driver behind agriculture and manufacturing. Across 2025 and 2026, targeted marketing and nature-focused infrastructure accelerated out-of-state visitor spending into record territory.
Comparative Shift: 2025 vs. 2026
In 2025, Nebraska’s tourism ecosystem experienced substantial financial momentum. Total direct visitor spending surpassed $4.5 billion, generating approximately $335 million in state and local tax receipts—saving each Nebraska household roughly $400 in annual taxes. A major turning point in 2025 was the surge in rural tourism: the 90 counties outside the metropolitan hubs of Douglas, Lancaster, and Sarpy captured over $1.2 billion in direct out-of-state expenditure.
Entering 2026, total direct visitor spending is projected to approach $4.8 billion. While Omaha and Lincoln remain the volume centers, 2026 highlights a wider spatial and seasonal dispersal:
- Ecotourism and Shoulder-Season Travel: The spring Sandhill crane migration through the central Platte River Valley reached an unprecedented $28 million in regional impact, drawing visitors from all 50 states and over 45 countries in late winter and early spring.
- The Nebraska Passport Influence: The statewide passport program expanded participation among regional drive-market tourists, driving cross-county travel into historic Sandhills communities and away from purely interstate-adjacent corridors.
- Urban Sports and Culture Expansion: The Omaha Men’s College World Series and renovations across Omaha’s RiverFront and downtown convention infrastructure maintained high metropolitan occupancy rates through peak summer.
| Metric / Indicator | 2025 Recorded Data | 2026 Projections & Trends |
| Direct Traveler Spending | ~$4.55 billion | ~$4.78 billion |
| State & Local Tax Contribution | ~$335 million | ~$350 million |
| Rural Tourism Spending (90 Counties) | ~$1.20 billion | ~$1.32 billion |
| Omaha Metro Attraction Share | ~60% of visitor totals | ~57% (rural share rising) |
| Top Travel Driver | Leisure & Road Trips (81%) | Leisure & Ecotourism (83%) |
Who Visits Nebraska Most?
Regional drive markets generate the vast majority of Nebraska’s leisure visitors:
- Top Feeder States: Neighboring Midwestern states make up the bulk of inbound travel, led by Iowa, Kansas, Missouri, South Dakota, Colorado, and Minnesota. Travelers from Illinois and Texas represent significant secondary sources for major events.
- Traveler Demographics: Families traveling by car dominate summer months, particularly around family-oriented cultural attractions. Autumn and spring visitors trend older (ages 50–70), visiting primarily for wildlife migrations, paleontology sites, and scenic drives.
- International Visitors: International arrivals remain niche, primarily drawing birding enthusiasts, agritourists, and road-trippers tracing historic western expansion trails like the Oregon and Mormon trails.
Why They Come
1. World-Renowned Wildlife and Nature Wonders
Advertisement
Advertisement
Nebraska hosts one of North America’s premier wildlife spectacles: over 500,000 Sandhill cranes gathering along the Platte River each March. Beyond birding, travelers head to the Nebraska Sandhills—the largest sand dune formation in the Western Hemisphere—as well as Scotts Bluff National Monument and Chimney Rock along the North Platte River.
2. Premier Family Attractions and Urban Events
Omaha’s Henry Doorly Zoo and Aquarium draws over 1.5 million visitors annually, consistently ranking as a top domestic zoo. Large sporting events, anchored by the NCAA Men’s College World Series and Husker athletics, bring hundreds of thousands of out-of-state fans into Omaha and Lincoln.
3. Western Heritage and Authentic Americana
Nebraska draws travelers seeking unhurried, off-the-beaten-path road trips. Scenic byways like Highway 2, preserved prairie ecosystems, stargazing in designated dark-sky spots like Merritt Reservoir, and small-town pioneer hospitality appeal to travelers escaping overcrowded national parks and urban centers.
Advertisement
Advertisement
Nevada Tourism Transformation: A 2025–2026 Comparative Analysis
Nevada’s tourism economy is recalibrating across 2025 and 2026. While high-end entertainment, elite conventions, and sports anchored record gaming revenue, the Silver State is balancing premium leisure pricing against the return of budget-conscious, volume-driving travelers.
Comparative Shift: 2025 vs. 2026
In 2025, Nevada navigated a divergence between visitor volume and visitor spend. Las Vegas recorded 38.5 million visitors—a 7.5% drop from 2024—primarily caused by inflationary pressures, reduced mid-tier leisure trips, and softer Canadian flight volume. However, statewide gaming revenue hit an all-time record of $15.8 billion, demonstrating that while overall headcount dipped, per-capita spending surged. The convention segment served as a vital anchor, delivering 6.0 million attendees who outspent typical leisure travelers by roughly 33%.
By 2026, Nevada’s tourism landscape stabilized and showed clear signs of recovery, with visitation projected to rebound toward 40.5 million travelers. Key strategic changes between 2025 and 2026 include:
- Convention and Trade Show Resurgence: Major multi-year rotating expos (such as CONEXPO) and expanding convention center schedules lifted business travel, pushing convention attendance up roughly 8% to 10% over 2025 levels.
- Sports and Entertainment Maturation: Nevada firmly solidified its identity as the world’s sports capital. Between the Formula 1 Las Vegas Grand Prix, major combat sports, WrestleMania 42, and Allegiant Stadium headliners, ticketed entertainment spending proved the most inflation-resistant category statewide.
- Geographic Dispersal Beyond the Strip: Lake Tahoe, Reno, and rural eco-destinations (such as Great Basin National Park and Valley of Fire) gained traffic from road-trippers seeking outdoor recreation, star-gazing, and mountain sports to balance high urban room rates.
| Metric / Indicator | 2025 Recorded Data | 2026 Projections & Trends |
| Las Vegas Visitor Volume | 38.5 million | ~40.5 million |
| Nevada Statewide Gaming Revenue | $15.8 billion (Record) | ~$16.0 billion |
| Las Vegas Strip Hotel Occupancy | 80.3% | ~82.5% |
| Convention Attendees | 6.0 million | ~6.4–6.6 million |
| Average Daily Room Rate (ADR) | $183.52 (Strip: ~$199.79) | ~$188.00 |
Who Visits Nevada Most?
Drive-market dominance and major metro corridors supply the core of Nevada’s out-of-state arrivals:
- Top Feeder States: Southern California remains Nevada’s largest market, accounting for roughly 28% to 30% of Las Vegas arrivals via the Interstate 15 corridor. Arizona, Utah, Texas, and Washington generate the next largest domestic visitor pools, while Northern California supplies the bulk of Reno-Tahoe visitation.
- Traveler Demographics: Nearly half (48%) of inbound overnight travelers report household incomes exceeding $140,000. Repeat visitors comprise over 75% of overall arrivals, with an average party size of 2.1 persons.
- International Visitors: Historically anchored by Mexico, Canada, and the United Kingdom, international leisure faced mild exchange-rate headwinds in 2025 before rebounding in 2026 due to expanded transatlantic routes and international sports scheduling.
Why They Come
1. Unrivaled Spectacle, Gaming, and Nightlife
Advertisement
Advertisement
The Las Vegas Strip and Fremont Street remain global icons of casino gaming, Michelin-starred culinary dining, dayclubs, and residency shows. Visitors travel for integrated resort experiences that offer world-class entertainment without leaving the property.
2. Global Conventions and Business Trade Shows
Home to three of the country’s ten largest convention venues, Nevada draws millions for heavyweight expos like CES, World of Concrete, and SEMA. Corporate travelers benefit from an unmatched concentration of 150,000+ hotel rooms within minutes of major meeting halls.
3. Major Sports Tourism and Outdoor Recreation
Nevada has transformed into a premier stadium and arena destination, attracting out-of-state fans for NFL games, NHL matches, and motorsports. Simultaneously, northern and rural Nevada draw outdoor enthusiasts for Sierra Nevada skiing, Lake Tahoe boating, and off-road desert exploration.
Advertisement
Advertisement
New Hampshire Tourism Dynamics: A 2025–2026 Comparative Analysis
New Hampshire’s travel sector remains the state’s second-largest economic pillar, navigating a transition across 2025 and 2026 toward higher-yield, year-round visitation. Strategic campaigns and four-season infrastructure continue to anchor visitor spending while moderating peak-season strain on natural corridors.
Comparative Shift: 2025 vs. 2026
In 2025, New Hampshire maintained robust economic performance across all four travel seasons, recording approximately 14.1 million visitors. Out-of-state visitor spending reached $7.2 billion, sustaining more than 60,000 tourism-supported jobs and contributing over $310 million to state and local tax revenue. Summer continued to serve as the dominant anchor, generating roughly 4.5 million travelers and $2.55 billion in direct spend, bolstered by lakeside retreats and hiking corridors. However, early-year comparisons felt the absence of the temporary 2024 total solar eclipse rush in the Great North Woods.
Entering 2026, statewide visitation grew to approximately 14.4 million travelers, pushing overall visitor spending toward $7.5 billion. Key qualitative and behavioral developments separating 2025 and 2026 include:
- Stewardship & Sustainable Tourism: Through the statewide launch of the “Wildly Responsible” sustainability and safety initiative, the state began actively dispersing visitors from congested trailheads in the White Mountain National Forest toward lesser-known state parks and regional communities.
- Winter & Shoulder-Season Capitalization: Unpredictable winter precipitation led ski resorts to expand snowmaking capacity and year-round alpine coaster/zipline attractions, boosting off-season resilience.
- Expanding Overseas Recovery: While cross-border Canadian vehicle traffic experienced mild fluctuations due to currency headwinds, overseas arrivals grew nearly 15%, reaching over 96,000 international visitors.
| Metric / Indicator | 2025 Recorded Data | 2026 Projections & Trends |
| Total Non-Resident Visitors | ~14.1 million | ~14.4 million |
| Direct Visitor Spending | ~$7.2 billion | ~$7.5 billion |
| Summer Season Share | ~4.5 million visitors ($2.55B) | ~4.6 million visitors ($2.60B) |
| State & Local Tax Contribution | ~$310 million | ~$325 million |
| Primary Mode of Arrival | Personal Vehicle / Road Trip (~88%) | Personal Vehicle / Road Trip (~86%) |
Who Visits New Hampshire Most?
Drive-market accessibility from dense neighboring metropolitan corridors supplies the bulk of the state’s arrivals:
- Top Feeder States: Massachusetts represents New Hampshire’s single largest feeder market, generating over 35% of all overnight leisure travel. Other major regional contributors include Connecticut, New York, Maine, Rhode Island, and Vermont.
- International Visitors: Historically, Quebec and Atlantic Canada form the largest international contingents via northern border crossings. In addition, the United Kingdom, Ireland, and Germany lead overseas long-haul arrivals, specifically during the autumn foliage season.
- Traveler Demographics: Families dominate the summer season around coastal and lake regions, whereas active outdoor recreationists (ages 25–45) and affluent retirees (ages 55+) fuel the autumn and winter shoulder seasons.
Why They Come
1. Rugged Alpine Landscapes and Outdoor Recreation
Advertisement
Advertisement
The White Mountain National Forest and Mount Washington—the highest peak in the Northeast—serve as premier hubs for hiking, mountaineering, and scenic drives like the Kancamagus Highway. In winter, premier ski areas such as Bretton Woods, Loon Mountain, and Cannon Mountain draw regional winter sports enthusiasts.
2. Lakes, Waterways, and Coastal Escapes
The Lakes Region, centered around Lake Winnipesaukee and Squam Lake, offers expansive boating, cottage rentals, and waterfront towns. Though compact, New Hampshire’s 18-mile Atlantic seacoast draws summer beachgoers to Hampton Beach and heritage seekers to historic Portsmouth.
3. Iconic Autumn Foliage and Tax-Free Shopping
“Leaf-peeping” in September and October generates some of the highest lodging occupancy rates in the country, attracting global travelers. Alongside natural attractions, New Hampshire’s lack of a general sales tax creates a durable retail corridor for outlet shopping in North Conway and Merrimack.
Advertisement
Advertisement
The 2025–2026 travel cycle proves that long-term regional vitality depends on targeted differentiation rather than unmanaged headcount expansion.
While Nevada commands unmatched per-capita expenditures through global conventions, sporting spectacles, and luxury gaming, Montana and New Hampshire successfully balance alpine bottlenecks by expanding shoulder-season corridors and active conservation initiatives. Simultaneously, Nebraska transforms traditional road-trip traffic into an emerging economic engine by channeling urban travelers directly into rural heartland communities through world-class wildlife migrations.
Across all four destinations, modern tourism success is defined by high visitor yield, dispersed geographic impact, and sustainable resource management.
Advertisement
