
Oxford and Mississippi Emerge Alongside College Station and Other US University Towns as Thanksgiving 2026 Rental Bookings Skyrocket

Published
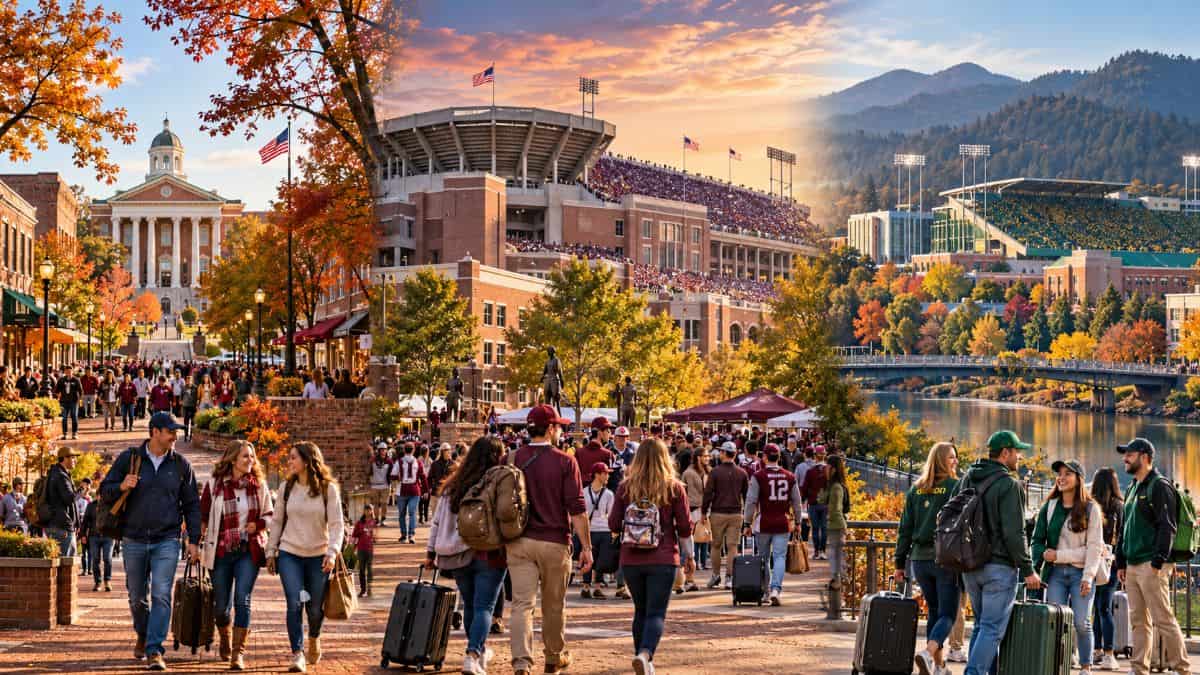
Thanksgiving 2026 is generating an extraordinary short-term rental booking surge across American university towns, with Oxford, Mississippi, recording 297.2% year-on-year growth, College Station, Texas, rising 173.3%, and Eugene, Oregon, climbing 78.8%. AirDNA’s September review recorded these increases in Thanksgiving stays booked by 5 October, ahead of the 26 November holiday. Major college football fixtures coincide with the travel window, creating a compelling explanation for the concentrated demand. However, the emerging pattern raises wider questions about university visits, accommodation capacity, rental pricing and the economic opportunities smaller destinations can capture during America’s busiest domestic travel period.
Thanksgiving Demand Finds an Unexpected College-Town Advantage
The latest booking figures place three university communities at the centre of an emerging American holiday travel story. Their growth rates stand out because Thanksgiving brings together family reunions, campus connections and major sporting events within a concentrated period. For accommodation operators, the overlap creates opportunities to attract visitors who might otherwise make shorter trips or stay outside university districts.
Advertisement
Advertisement
AirDNA’s analysis covers Wednesday-to-Saturday nights around Thanksgiving, using bookings already on the books on 5 October 2026. Oxford recorded 2,439 nights, College Station registered 2,856 and Eugene reached 3,165. These figures represent booked nights at the reporting snapshot, not final occupied nights, individual visitors or completed stays.
The surrounding-week comparison makes the results more revealing. Oxford’s Thanksgiving bookings grew 133.6% across nearby weeks, whereas College Station’s nearby-week bookings declined 28.8% and Eugene’s fell 46.7%. The contrast suggests a particularly concentrated holiday effect in Texas and Oregon, although the figures cannot establish the precise reasons behind each reservation.
Advertisement
Advertisement
| Destination | Thanksgiving booking growth | Nearby-week growth | Thanksgiving nights booked |
|---|---|---|---|
| Oxford, Mississippi | +297.2% | +133.6% | 2,439 |
| College Station, Texas | +173.3% | −28.8% | 2,856 |
| Eugene, Oregon | +78.8% | −46.7% | 3,165 |
The central distinction is between booking momentum and realised tourism performance. A sharp increase in reservations does not automatically mean higher prices, fuller hotels or greater total visitor spending. Final occupancy, cancellation rates, available inventory and actual accommodation revenue will determine whether the early surge translates into a wider tourism windfall.
Football Rivalries Recast the Holiday Calendar
The 2026 calendar offers an unusually strong opportunity to investigate event-led travel. Ole Miss hosts Mississippi State in Oxford on Friday, 27 November, while Texas A&M welcomes Texas to College Station that evening. Oregon then hosts Washington in Eugene on Saturday, 28 November, placing three major fixtures within the Thanksgiving travel period.
Advertisement
Advertisement
The Oxford game, known as the Egg Bowl, kicks off at 11 am Central Time. Texas A&M’s Lone Star Showdown against Texas is scheduled for 6.30 pm Central Time, while Oregon’s game against Washington has a kick-off time yet to be confirmed. These schedules create different arrival and departure patterns, potentially affecting which nights experience the greatest accommodation pressure.
| Destination | Major fixture | Date | Potential travel effect |
|---|---|---|---|
| Oxford | Ole Miss vs Mississippi State | 27 November | Early kick-off may encourage Thursday arrivals |
| College Station | Texas A&M vs Texas | 27 November | Evening game may support multi-night stays |
| Eugene | Oregon vs Washington | 28 November | Saturday fixture may extend the holiday weekend |
The sporting calendar provides a plausible explanation for the booking surge, but it should not be treated as proof of causation. Researchers would need to compare similar weekends without major home games, alongside historical booking patterns and hotel performance. That comparison could establish whether football contributes incremental overnight visits or mainly shifts existing travel towards particular dates.
Advertisement
Advertisement
For travellers, the practical implication is immediate. Families planning Thanksgiving visits should check university sporting schedules before selecting accommodation dates, particularly when they need several bedrooms or proximity to a stadium. Visitors without tickets should also compare neighbourhoods outside the immediate campus area, where travel costs may offset any lower nightly rate.
Oxford Commands Attention as Rental Supply Contracts
Oxford’s 297.2% Thanksgiving booking increase is the largest among the three featured destinations. AirDNA counted 2,439 holiday nights on the books by 5 October, while its September market profile recorded 1,650 active short-term rental listings. The city’s trailing-twelve-month average daily rate stood at $431, with average occupancy at 32%.
The annual market indicators reveal a more complicated picture than the booking surge alone suggests. Average daily rates fell 35.9% year on year, while occupancy declined 8.5%. Active listings contracted 28.3%, yet annual revenue per listing increased 82.4% to approximately $41,000. These measures cover the wider market, not Thanksgiving alone, and do not guarantee comparable earnings for individual properties.
| Oxford rental indicator | September 2026 figure |
|---|---|
| Thanksgiving nights booked | 2,439 |
| Active listings | 1,650 |
| Average daily rate | $431 |
| Average occupancy | 32% |
| Annual revenue per listing | $41,000 |
| Active listings change year on year | −28.3% |
The combination of declining listing numbers and lower annual rates deserves closer scrutiny. It could reflect changes in property composition, market conditions or demand across different seasons. The available figures do not establish that Oxford faces a Thanksgiving-specific shortage or that holiday prices have increased.
Advertisement
Advertisement
The Egg Bowl nevertheless creates a clear reason for visitors to examine accommodation early. The rivalry returns to Oxford on Friday morning, potentially drawing supporters who arrive on Thursday and remain after the game. That pattern could overlap with family reunions, alumni visits and other holiday travel.
For visitors, the $431 annual average daily rate should serve only as market context. It is not a live quotation for Thanksgiving, nor does it represent the cheapest or most expensive available property. Travellers should compare complete stay costs, including taxes, cleaning fees, parking, minimum-night requirements and cancellation terms.
Oxford also sits within a state benefiting from substantial tourism activity. Mississippi recorded 45.5 million visitors in 2025, generating $12.4 billion in visitor spending and $18.9 billion in total economic impact, according to the state’s tourism economic contribution report. Tourism supported 137,728 jobs statewide. Those figures demonstrate the sector’s wider importance, but they cannot be attributed to Oxford’s holiday booking growth.
College Station Pairs Rental Growth With a Rivalry Weekend
College Station recorded 173.3% growth in Thanksgiving bookings, with 2,856 nights already on the books by 5 October. AirDNA’s September profile listed 1,323 active short-term rentals, a $232 average daily rate and 43% average occupancy. Annual revenue per listing reached approximately $33,000, increasing 62.2% year on year.
The market differs from Oxford because its rental inventory expanded. Active listings increased 18.7% year on year, while average daily rates declined 40.1%. Occupancy rose 9.6%, even as revenue per available night fell 30.3%. These indicators describe different aspects of market performance and demonstrate why booking growth alone cannot establish profitability.
| College Station rental indicator | September 2026 figure |
|---|---|
| Thanksgiving nights booked | 2,856 |
| Active listings | 1,323 |
| Average daily rate | $232 |
| Average occupancy | 43% |
| Annual revenue per listing | $33,000 |
| Active listings change year on year | +18.7% |
Texas A&M’s Friday-evening fixture against Texas provides a compelling event-related travel angle. The Lone Star Showdown at Kyle Field may attract supporters arriving before Thanksgiving, while some families could combine the match with visits to students and university activities. However, the extent of additional overnight demand remains unmeasured.
Advertisement
Advertisement
College Station’s growing rental supply also raises a useful industry question. If more properties enter the market, accommodation operators may compete more aggressively outside major event periods. A major rivalry can then produce a concentrated booking spike without necessarily lifting annual prices across the entire destination.
For travellers, comparing total group costs is particularly important. A rental shared among several relatives may offer convenience, but cleaning fees and minimum-stay rules can reduce its advantage. Hotels farther from the stadium may provide better value when guests include transport, parking and cancellation flexibility in their calculations.
Eugene Records Strong Demand Despite Weaker Nearby Weeks
Eugene recorded a 78.8% year-on-year increase in Thanksgiving rental bookings, reaching 3,165 nights on the books by 5 October. Its September market profile showed 1,837 active listings, a $192 average daily rate and 51% average occupancy. Annual revenue per listing stood at approximately $30,800, up 61.1% year on year.
Oregon’s home game against Washington on Saturday, 28 November, creates a different pattern from the Friday fixtures in Oxford and College Station. Visitors may arrive earlier in the holiday week and remain through Saturday night, although actual stays will depend on travel origins, game attendance and accommodation availability. The fixture offers a useful case study for examining whether Saturday games extend Thanksgiving visits.
| Eugene rental indicator | September 2026 figure |
|---|---|
| Thanksgiving nights booked | 3,165 |
| Active listings | 1,837 |
| Average daily rate | $192 |
| Average occupancy | 51% |
| Annual revenue per listing | $30,800 |
| Active listings change year on year | −12.7% |
Eugene’s surrounding-week bookings fell 46.7% year on year, despite the Thanksgiving increase. Its annual average occupancy rose 2.6%, while its average daily rate declined 29.6%. These movements suggest a market where the holiday booking window behaves differently from the wider annual pattern.
The contrast also challenges assumptions about destination rankings. Eugene has the highest annual average occupancy of the three markets and the greatest number of Thanksgiving nights booked. Yet its booking growth rate is the lowest. Percentage growth, absolute volume and occupancy therefore answer different questions.
Advertisement
Advertisement
For visitors, Eugene offers a reason to compare accommodation by location and total journey cost rather than nightly price alone. A property farther from Autzen Stadium may be less expensive, but the savings could disappear through transport costs or limited availability. Because the game time remains unconfirmed, travellers should check the official athletics schedule before finalising their plans.
College Football Towns Challenge America’s Traditional Thanksgiving Getaways
Thanksgiving 2026 is revealing a striking contrast between university towns and established leisure destinations, as Oxford, Mississippi, College Station, Texas, and Eugene, Oregon, record substantial short-term rental booking increases. AirDNA’s September review reported growth of 297.2% in Oxford, 173.3% in College Station and 78.8% in Eugene, measured against the same point in 2025. Traditional destinations also recorded gains, however, suggesting that the trend is not exclusive to college communities. Sarasota, Florida, registered 50.9% growth, Buffalo/Niagara Falls rose 79.7%, and Stamford/New Haven increased 15.6%. The comparison highlights how sporting fixtures, seasonal attractions and family travel can generate different booking patterns across the American holiday market.
The crucial distinction is that booking growth does not necessarily indicate higher prices, greater visitor spending or stronger hotel occupancy. College towns may benefit from the concentration of home games, alumni gatherings and university family visits, while traditional destinations attract travellers through beaches, shopping, established attractions and seasonal experiences. Oxford’s exceptional increase could reflect a particularly favourable combination of holiday and football demand, whereas Sarasota offers a useful warm-weather comparison. Nevertheless, these destinations have different accommodation inventories and visitor profiles, so their growth rates should not be treated as a direct ranking of tourism performance.
| Destination | Thanksgiving rental booking growth year on year | Main travel proposition | What travellers should compare |
|---|---|---|---|
| Oxford, Mississippi | +297.2% | University visits and the Egg Bowl rivalry | Rental availability, stadium access and minimum stays |
| College Station, Texas | +173.3% | Texas A&M campus visits and the Texas rivalry | Group accommodation, parking and total stay costs |
| Eugene, Oregon | +78.8% | University tourism and Oregon football | Saturday-night availability and transport |
| Sarasota, Florida | +50.9% | Beaches, coastal leisure and warm-weather escapes | Seasonal rates, beach access and car hire |
| Buffalo/Niagara Falls | +79.7% | Niagara attractions and established sightseeing | Attraction access, weather and accommodation location |
| Stamford/New Haven, Connecticut | +15.6% | Coastal New England access and regional visits | Rail connections, local attractions and total journey costs |
Smaller Markets Face a Bigger Capacity Test
The booking surge raises a broader question for American tourism: can university towns capture more holiday accommodation spending than their size would normally suggest? The current data demonstrates exceptional rental demand in selected destinations, but it does not prove that travellers are abandoning major cities or transferring spending away from metropolitan markets.
A wider comparison provides useful context. AirDNA’s September review also reported Thanksgiving booking growth of 119.8% in Lubbock, Texas, 79.4% in Columbus, Ohio, and 136.3% in Tallahassee, Florida. The pattern suggests that strong university-market demand extends beyond the three headline destinations, although individual sporting calendars and local attractions may explain different results.
| Additional university market | Thanksgiving booking growth | Nearby-week growth |
|---|---|---|
| Lubbock, Texas | +119.8% | +25.6% |
| Columbus, Ohio | +79.4% | +26.1% |
| Tallahassee, Florida | +136.3% | +107.8% |
The next step is to compare these markets with major metropolitan destinations and university towns without similarly timed home games. Researchers should examine whether holiday booking growth remains stronger after controlling for the weekday of Thanksgiving, event schedules and changes in available accommodation. Multi-year comparisons would help distinguish a lasting trend from a favourable calendar effect.
Advertisement
Advertisement
The economic implications extend beyond property owners. Additional overnight visitors may spend at restaurants, shops, attractions and transport businesses. Nevertheless, more rental reservations do not automatically translate into greater net economic activity if visitors simply switch from hotels or shorten other trips.
Local tourism organisations could strengthen their planning by combining booking data with hotel performance, visitor-origin information, local tax receipts and spending estimates. Such evidence would help establish whether the surge generates additional tourism revenue and whether businesses can convert concentrated event demand into more consistent year-round visits.
Hotel Performance Will Decide the Wider Story
The largest evidence gap concerns hotels. The current figures establish short-term rental booking growth, but they do not confirm a corresponding increase in hotel occupancy, average daily rates or revenue per available room. Those indicators are essential before describing the trend as a combined hotel-and-rental boom.
Hotel operators and destination organisations should compare daily performance from 25–29 November 2026 with equivalent dates in 2025. Occupancy would indicate how much available room inventory hotels sell, while average daily rates would reveal the prices achieved. Revenue per available room combines the two, helping show whether higher demand translates into stronger accommodation performance.
Supply data matters just as much. A destination may experience higher occupancy because fewer rooms are available, even if the number of visitors remains unchanged. Conversely, a market with growing rental inventory may absorb additional bookings without comparable capacity pressure. Comparing available rooms, cancellations and final occupied nights would clarify which scenario applies.
Travellers would benefit from a matched hotel-versus-rental cost comparison. Researchers should use identical dates, group sizes, cancellation conditions and accommodation standards, including taxes and additional fees. Until such evidence becomes available, readers should not assume that a short-term rental is necessarily cheaper than a hotel during the Thanksgiving period.
Advertisement
Advertisement
Booking Early Requires More Than Chasing Headlines
The figures provide a timely warning for visitors planning university-town holidays, but they do not establish that every property is becoming scarce. Booking pace varies by neighbourhood, property type, group size and cancellation policy. Travellers should therefore compare live availability rather than rely on a citywide percentage increase.
Families visiting students should check university academic calendars alongside sporting fixtures. Thanksgiving break arrangements vary between institutions, which can affect when students leave campus, when relatives arrive and how demand spreads across the week. A home game may intensify demand, but academic schedules and family travel can also influence accommodation patterns.
Visitors should compare flexible dates wherever possible, particularly when attending a Saturday fixture. They should also verify transport arrangements, parking restrictions and the time required to reach stadiums. A lower-priced property outside the centre may offer better overall value if transport remains straightforward, but not if it adds substantial cost or inconvenience.
Accommodation operators face a different challenge. They need to distinguish event-specific demand from sustained market growth before changing pricing or inventory strategies. The annual data shows that the three destinations have experienced different combinations of rental supply, occupancy and average daily rates, making a single pricing strategy unsuitable for all three.
The Thanksgiving Pattern Worth Tracking Next
Thanksgiving 2026 has produced a striking short-term rental booking surge across Oxford, College Station and Eugene, with football fixtures offering a persuasive explanation for the timing. Oxford’s 297.2% growth, College Station’s 173.3% rise and Eugene’s 78.8% increase establish the scale of the current booking momentum. However, the figures remain a snapshot rather than a final measure of visitors, revenue or hotel demand.
A meaningful follow-up should compare final occupancy, realised prices, available inventory and visitor spending with previous Thanksgiving periods. It should also account for the changing holiday calendar and the timing of major university events. Those comparisons will reveal whether these towns are attracting additional visitors or concentrating existing demand into a particularly strong weekend.
Advertisement
Advertisement
For travellers, the lesson is to consider football schedules when choosing holiday dates and to compare complete accommodation costs before booking. For tourism businesses, the opportunity lies in understanding how university visits, sporting events and family travel interact. The real test is whether this exceptional booking pace becomes a repeatable source of tourism growth beyond Thanksgiving 2026.
Advertisement
