
Botswana Unites Mozambique and Other Countries as SADC Travel Strengthens South Africa Tourism

Published
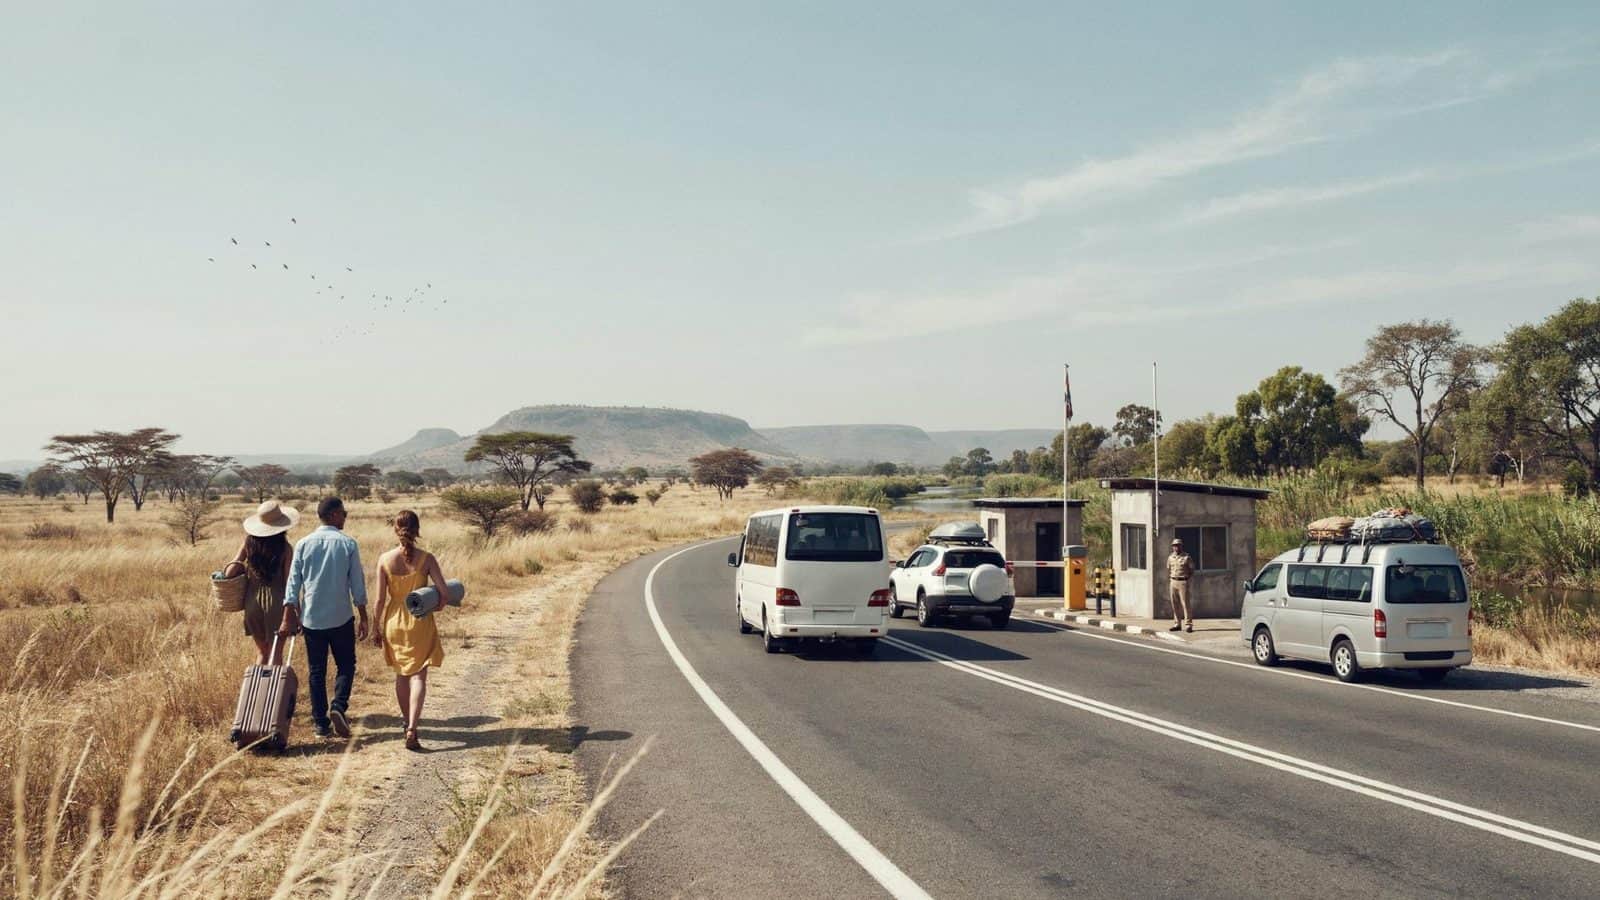
Image generated with Ai
Botswana joins Mozambique, Zambia, Malawi and other SADC countries in sustaining a powerful regional tourism corridor into South Africa. The latest official evidence shows that neighbouring Southern African markets remain central to South Africa tourism, with cross-border movement shaping visitor flows, transport demand and destination access. Mozambique remains particularly influential, while Botswana, Zambia and Malawi add important regional depth. The pattern also reveals a tourism economy closely connected by road networks and shared borders. As regional tourism strengthens South Africa, the SADC market continues to influence how travellers enter the country, where transport pressure develops and how Southern Africa functions as an interconnected tourism region.
Why Are SADC Countries So Important to South Africa Tourism in 2026?
SADC countries form the largest geographical source of tourists entering South Africa. In August 2026, SADC residents represented 78.3% of all recorded tourists in the country and 98.3% of tourists arriving from Africa. The geographical concentration was also substantial. Mozambique, Zimbabwe and Lesotho alone generated more than three-quarters of the SADC total. Six of the ten largest SADC source markets recorded year-on-year growth. This demonstrates that South Africa’s tourism performance cannot be understood solely through long-haul aviation markets. Regional mobility, neighbouring economies, land borders and frequent cross-border journeys remain essential components of the country’s inbound tourism structure.
Advertisement
Advertisement
- SADC generated 787,231 tourists to South Africa in August 2026.
- SADC represented 78.3% of all tourists recorded nationally.
- SADC supplied 98.3% of tourists arriving from Africa.
- The ten largest SADC markets accounted for 99.2% of SADC tourists.
- Six of the ten leading SADC source countries recorded year-on-year increases.
Leading SADC Tourism Markets for South Africa
| SADC source market | August 2025 | August 2026 | Share of SADC tourists | YoY change |
|---|---|---|---|---|
| Mozambique | 193,313 | 231,398 | 29.4% | +19.7% |
| Zimbabwe | 218,395 | 224,686 | 28.5% | +2.9% |
| Lesotho | 115,660 | 135,672 | 17.2% | +17.3% |
| Eswatini | 96,023 | 98,235 | 12.5% | +2.3% |
| Botswana | 36,514 | 30,803 | 3.9% | -15.6% |
| Malawi | 20,750 | 22,136 | 2.8% | +6.7% |
| Namibia | 13,469 | 15,680 | 2.0% | +16.4% |
| Zambia | 15,588 | 14,981 | 1.9% | -3.9% |
| Angola | 4,540 | 4,125 | 0.5% | -9.1% |
| Democratic Republic of Congo | 4,102 | 3,451 | 0.4% | -15.9% |
How Are Botswana, Mozambique, Zambia and Malawi Shaping Regional Tourism?
The four highlighted markets show that regional tourism is moving at different speeds. Mozambique recorded particularly strong growth, while Malawi also finished August above its comparable 2025 level. Zambia declined during the month but remained substantially higher across the first eight months of 2026. Botswana registered a decline both in August and across January to August. This distinction matters. A single month’s movement does not always reflect the broader annual trajectory. Mozambique stands out because growth was strong on both measurements, while Zambia’s cumulative performance remained positive despite its August contraction. Together, these markets demonstrate the diversity within South Africa’s regional tourism demand.
- Mozambique increased 19.7% year on year in August.
- Malawi increased 6.7% in August.
- Zambia fell 3.9% in August, but its January-August total increased.
- Botswana declined 15.6% in August.
- Mozambique recorded the strongest cumulative growth among these four markets.
Botswana, Mozambique, Zambia and Malawi Tourism Performance
| Country | Aug 2026 | Aug YoY | Jan-Aug 2025 | Jan-Aug 2026 | Jan-Aug YoY |
|---|---|---|---|---|---|
| Mozambique | 231,398 | +19.7% | 1,346,238 | 1,734,280 | +28.8% |
| Botswana | 30,803 | -15.6% | 253,867 | 246,466 | -2.9% |
| Malawi | 22,136 | +6.7% | 160,233 | 161,320 | +0.7% |
| Zambia | 14,981 | -3.9% | 108,190 | 120,069 | +11.0% |
Why Is Mozambique Becoming Such a Major Regional Travel Market for South Africa?
Mozambique occupies a distinctive position in the South Africa tourism market because of its scale, proximity and transport profile. It was South Africa’s largest SADC tourist source in August 2026 and also recorded the strongest increase among the ten leading regional markets. Its performance was not limited to one month. January-August arrivals were 28.8% above the comparable 2025 period. The flow is overwhelmingly land-based, reinforcing the importance of cross-border road tourism. Statistics South Africa recorded more tourists entering through Lebombo than through any other road port during August. Mozambique’s performance therefore illustrates how border infrastructure can intersect directly with regional tourism volumes.
Advertisement
Advertisement
- Mozambique was the largest SADC source market in August.
- It supplied 29.4% of SADC tourists.
- August arrivals increased by 38,085 year on year.
- January-August arrivals increased by 28.8%.
- Mozambique tourism flows were overwhelmingly road-based.
Mozambique Travel Profile
| Indicator | August 2026 |
|---|---|
| Total tourists | 231,398 |
| SADC market share | 29.4% |
| Arriving by road | 227,301 |
| Arriving by air | 4,097 |
| Holiday category | 229,501 |
| Business category | 1,834 |
How Do Botswana, Zambia and Malawi Add Different Travel Patterns?
Botswana, Zambia and Malawi contribute smaller visitor volumes than Mozambique, but their travel profiles reveal different dimensions of regional demand. Botswana remained a predominantly road-based market despite its year-on-year decline. Malawi combined a comparatively higher reliance on air access with substantial road traffic. Zambia showed an even more balanced transport profile, with a significant proportion entering by air while road arrivals remained dominant. Their purpose-of-visit profiles also differed. Holiday travel was predominant from Botswana and Malawi, while Zambia recorded a materially larger business component. These variations matter for destination planning because SADC tourism cannot be treated as a single, uniform traveller segment.
- Botswana remains strongly connected to South Africa through road travel.
- Malawi generated more than 22,000 tourists during August.
- Zambia recorded positive cumulative growth through August despite its monthly fall.
- Zambia had a notably larger business-travel component than Malawi.
- Transport patterns differ substantially even among geographically connected SADC markets.
Transport Profile of Four Key SADC Markets
| Country | Total tourists | By air | By road | Road share |
|---|---|---|---|---|
| Mozambique | 231,398 | 4,097 | 227,301 | 98.2% |
| Botswana | 30,803 | 3,029 | 27,774 | 90.2% |
| Malawi | 22,136 | 3,497 | 18,639 | 84.2% |
| Zambia | 14,981 | 4,760 | 10,221 | 68.2% |
Why Does Road Travel Matter So Much for SADC Tourism?
The dominance of road travel is one of the clearest structural features of regional tourism into South Africa. Across all SADC markets, 725,463 tourists entered by road during August, compared with 61,768 arriving by air. That means 92.2% of SADC tourists used road transport. By contrast, air travel dominated among overseas visitors. This difference gives border posts, highways and cross-border transport corridors an unusually important role in South Africa’s regional visitor economy. Lebombo and Beit Bridge recorded particularly high tourist traffic. Consequently, regional tourism performance depends not only on airline capacity but also on the efficiency and resilience of terrestrial gateways connecting South Africa with neighbouring states.
Advertisement
Advertisement
- 92.2% of SADC tourists arrived by road.
- Only 7.8% arrived by air.
- Lebombo handled 230,831 tourist entries in August.
- Beit Bridge handled 175,757 tourist entries.
- Regional tourism therefore depends heavily on land-border connectivity.
SADC Tourism by Mode of Entry
| Travel category | Tourists | Share |
|---|---|---|
| SADC tourists | 787,231 | 100% |
| Road arrivals | 725,463 | 92.2% |
| Air arrivals | 61,768 | 7.8% |
| Sea arrivals | 0 | 0% |
What Do Visitor Purposes Reveal About Southern Africa Travel Demand?
Official classifications show that personal and leisure-related travel dominated SADC tourism in August 2026. Statistics South Africa places vacation, visiting friends and relatives, shopping and certain other personal journeys within its broad “holiday” category. Under that methodology, 97.5% of SADC tourists were classified as holiday travellers. However, the four highlighted markets show meaningful differences beneath that regional average. Zambia recorded 3,295 business visitors, representing a much larger business component than Mozambique, Botswana or Malawi. Botswana and Mozambique were heavily concentrated in the holiday category. Understanding these differences can help tourism businesses distinguish leisure-led border traffic from commercially driven regional movement.
- Holiday travel represented 97.5% of all SADC tourism.
- SADC business visitors numbered 17,924.
- Mozambique’s visitor profile was overwhelmingly holiday-related.
- Botswana also recorded a highly leisure/personal-travel-oriented profile.
- Zambia showed a comparatively stronger business-travel contribution.
Purpose of Visit from Selected SADC Markets
| Country | Total | Business | Holiday | Study | Medical |
|---|---|---|---|---|---|
| Mozambique | 231,398 | 1,834 | 229,501 | 47 | 16 |
| Botswana | 30,803 | 543 | 29,994 | 248 | 18 |
| Malawi | 22,136 | 290 | 21,800 | 39 | 7 |
| Zambia | 14,981 | 3,295 | 11,621 | 52 | 13 |
How Is Regional Tourism Affecting South Africa’s Wider Travel Economy?
Regional tourism is providing both scale and resilience to South Africa’s inbound visitor economy. The country recorded 1,005,286 tourists in August 2026, up 7.4% year on year. From January through August, international tourist arrivals reached 7,581,455, an increase of 11.7%. SADC alone generated 5,879,708 tourists during that eight-month period, increasing 13.7% from the comparable period of 2025. This means regional African travel is not simply supplementary demand. It represents the core of South Africa’s inbound tourism volume. Continued performance therefore has direct implications for accommodation, attractions, retail, ground transport, border management and destination dispersal across the country.
Advertisement
Advertisement
- South Africa exceeded one million tourists during August.
- Total August tourism increased 7.4% year on year.
- January-August tourism increased 11.7%.
- SADC arrivals increased 13.7% over the first eight months.
- Regional markets remain the numerical foundation of inbound South Africa tourism.
South Africa Tourism Performance in 2026
| Indicator | 2026 result | Change |
|---|---|---|
| International tourists, August | 1,005,286 | +7.4% YoY |
| SADC tourists, August | 787,231 | +8.7% YoY |
| International tourists, Jan-Aug | 7,581,455 | +11.7% |
| African tourists, Jan-Aug | 6,001,535 | +13.4% |
| SADC tourists, Jan-Aug | 5,879,708 | +13.7% |
What Does This Mean for Travellers and the Tourism Industry?
For travellers, the data underscores how deeply South Africa is integrated into the wider Southern African travel network. High road-use rates mean border conditions and land-transport infrastructure can be just as important as airport connectivity for regional visitors. For tourism businesses, the market is highly concentrated geographically but diverse in purpose and transport behaviour. Mozambique generates major leisure-oriented road volumes. Zambia carries a stronger business component. Botswana remains important despite weaker recent comparisons, while Malawi continues to contribute steady cross-border demand. These patterns support a tourism strategy that treats road corridors, border gateways, accommodation, local attractions and regional itineraries as interconnected parts of the same visitor economy.
- Regional tourism requires strong border as well as airport infrastructure.
- SADC visitors are primarily road travellers.
- Source markets behave differently and should not be treated identically.
- Mozambique is a major volume and growth market.
- Cross-border travel supports tourism demand beyond traditional long-haul gateways.
Travel Impact Summary
| Tourism factor | 2026 evidence | Travel implication |
|---|---|---|
| Regional scale | SADC dominates African arrivals | Regional markets remain strategically important |
| Road dependence | 92.2% of SADC tourists use road | Border infrastructure matters |
| Mozambique growth | Strong monthly and cumulative increase | Rising pressure and opportunity along eastern corridors |
| Zambia pattern | Cumulative growth despite August decline | Monthly movements need long-term context |
| Market diversity | Different business and holiday profiles | Tourism products should reflect varied traveller needs |
Conclusion
Botswana unites Mozambique and other SADC countries as regional tourism strengthens South Africa through a travel ecosystem built around neighbouring markets, shared borders and frequent cross-border mobility. Mozambique provides exceptional scale, while Zambia, Malawi and Botswana demonstrate how different source markets contribute through varying travel purposes and transport patterns. The wider picture confirms that South Africa tourism is deeply connected to Southern Africa rather than dependent only on distant international markets. For destinations, transport providers and tourism businesses, the central message is clear: regional tourism remains fundamental to visitor movement, accessibility and market resilience, making stronger SADC connectivity increasingly relevant to South Africa’s long-term tourism development.
Advertisement
