Image generated with Ai
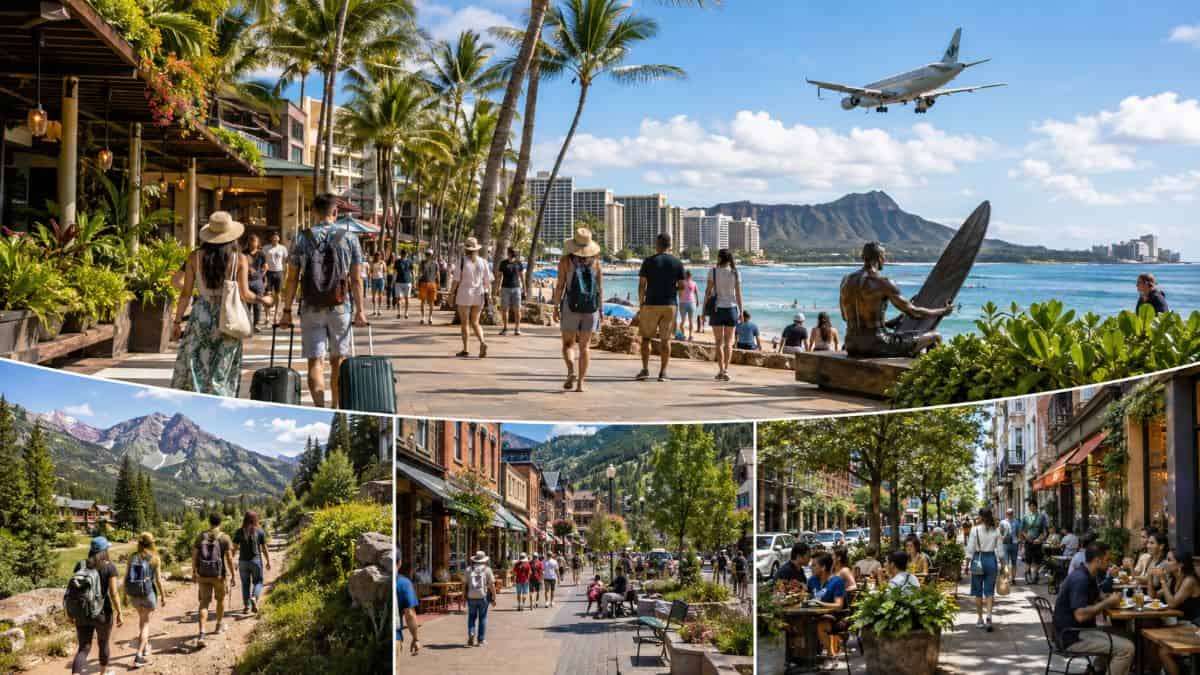
In Hawaii, the dispersal of visitors is leading to new patterns in tourism while residents’ priorities and increased economic involvement to other US destinations are driving tourism growth, particularly from abroad. Instead of tourism concentrated at specific times and at certain attractions, destinations are implementing tourism plans, community feedback, seasonal plans and local development to distribute tourism. This is especially true of Hawaii, which is pioneering this method, and Colorado and New York, which are using destination development and tourism at the neighborhood level. The new US model is not so much a restriction on tourism as a focus on places, seasons and experiences that can yield economic gain from tourism to a wider audience.
The US tourism 2026 landscape is increasingly shaped by destination stewardship rather than simple arrival growth. WTTC’s July 2026 framework argues that tourism planning should connect transport, housing, public space, infrastructure and community needs, while visitor flows should be spread across places and seasons. That direction is especially relevant as the US Department of Commerce forecasts 70.5 million international visitors to the United States in 2026, up 3.2% from 2025. With demand still expanding, the policy challenge is not only attracting travellers. It is managing where they go, when they travel and how local communities share tourism’s economic benefits sustainably.
Hawaii offers the clearest current example of this shift. The Hawaiʻi Tourism Authority’s 2026–2030 Strategic Plan, released in July 2026, is built around Brand Marketing, Experience Development and Tourism Leadership. The plan gives resident outcomes a place beside visitor economics. HTA says tourism performance will be tracked through resident sentiment, average daily visitor spending, visitor satisfaction and total visitor spending. It also requires annual visitor spending growth to outpace arrival growth. That changes the definition of success. A stronger tourism year is no longer simply one with more people arriving; it must also deliver higher value, community benefit and management.
Hawaii’s tourism model is measurable. Under its brand strategy, HTA is targeting higher-value visitors and more travel during shoulder seasons, when extra demand can generate economic activity without placing the same pressure on capacity. Experience development is designed around place-based products and community benefit, while tourism leadership focuses on coordination, data and accountability. These priorities follow WTTC’s recommendation that destinations judge performance through resident satisfaction and shared value rather than arrival totals alone. The approach also gives airlines, hotels and attractions a clearer signal: growth should generate more spending per visitor and better seasonal distribution, not simply larger peak-period crowds.
Advertisement
Advertisement
The latest official Hawaii data gives this strategy a strong 2026 context. Statewide visitor spending reached $1.99 billion in July 2026, up 1.7% year on year, while arrivals increased 1.1% to 883,248. Average daily spending rose 17.1% to $296 per person. Across the first seven months of 2026, Hawaii welcomed 5.92 million visitors, 2.3% more than a year earlier, while spending increased 5.6% to $13.63 billion. This gap between spending growth and arrival growth closely matches the value-led direction in HTA’s new plan. The figures show why expenditure, stay patterns and daily pressure now matter alongside headline arrivals today directly.
Hawaii’s aviation data adds another dimension. In July 2026, 5,745 transpacific flights supplied about 1.23 million seats, increases of 8.1% and 6.1% respectively from July 2025. Domestic nonstop capacity from the continental United States reached 1.04 million seats, up 8.7%. Yet the average visitor stay fell 14.1% to 7.59 days, while the statewide average daily visitor census dropped 13.1% to 216,319. This combination matters for tourism management. More airline capacity does not automatically mean more people are present on the islands at the same time. Length of stay, spending intensity and seasonal scheduling can significantly change destination pressure materially significantly.
Hawaii’s 2026–2028 Destination Management Action Plans move the strategy from statewide goals to specific sites. HTA has separate plans for Hawaiʻi Island, Kauaʻi, Lānaʻi, Maui, Molokaʻi and Oʻahu, with each plan identifying hotspots or places at risk of strain. The aim is to coordinate government, communities and the visitor industry around measurable actions instead of treating an entire island as overcrowded. Oʻahu illustrates the balance: 2025 visitor spending reached $9.42 billion, up 5.3%, while arrivals fell 1.99% to 5.68 million. Sixty per cent of residents said tourism brought more benefits than problems, while 55% said tourism was being better managed.
Colorado provides another US model. Official 2026 reporting shows travellers spent a record $29.2 billion in the state during 2025, up 2%, while visitation rose 1.4% to 96.8 million. Travel generated $1.91 billion in state and local tax revenue and directly supported 187,860 tourism jobs. The distribution question remains important because Denver and its surrounding metropolitan area accounted for $14.2 billion, or 48.5%, of statewide travel spending. Colorado’s destination stewardship framework is designed to balance resident quality of life, visitor experience and protection of natural and cultural resources, making geographic and seasonal distribution an economic as well as environmental issue.
Colorado’s 2025 tourism data also show why secondary destinations matter. The state recorded 96.8 million visitors, yet almost half of statewide tourism spending remained concentrated around Denver. Colorado has therefore continued programmes that support local tourism management and destination development outside its strongest gateway. Its 2026 Tourism Management Grant programme selected 13 recipients across the state, including destinations such as Cripple Creek, Grand Junction, Ouray, Pagosa Springs and Saguache County. The model links destination development with stronger visitor experiences and local economic participation. For travellers, this creates a broader tourism map built around mountain communities, rural areas, outdoor recreation and smaller destinations beyond major urban centres.
New York City shows how visitor dispersal can work in dense cities. Get Local NYC encouraged exploration across all five boroughs, but the 2026 FIFA World Cup provided a test. City programmes included a neighbourhood passport, a digital events map and promotions directing visitors towards local businesses and community events. After the tournament, the Mayor’s Office reported that more than one million visitors came to the New York–New Jersey region and that over 900 restaurants and bars joined the Five Borough Winners Special. This approach links major-event tourism with neighbourhood spending rather than concentrating benefits only around headline attractions.
The World Cup approach extended the logic of Get Local NYC rather than replacing it. New York used borough-wide events, restaurant participation, neighbourhood discovery tools and local-business rewards to direct large visitor flows beyond the most familiar tourist zones. Nearly 600 businesses had already enrolled in the Five Borough Winners Special before the tournament, with participation later exceeding 900 restaurants and bars. The city also promoted more than 100 free public watch parties and neighbourhood activities. For tourism planning, the important point is geographical: a global event can feed visitor spending into multiple communities when travellers receive practical reasons, information and incentives to move beyond established sightseeing corridors.
The national demand outlook makes these local strategies significant. The National Travel and Tourism Office forecasts total international visitation to the United States at 70.5 million in 2026, rising to 85.2 million by 2030. That would represent 25% growth from the 68.3 million visitors recorded for 2025. Inbound travellers support airlines, hotels, attractions and local businesses, but rising demand also increases the importance of distribution. Hawaii’s shoulder-season strategy, Colorado’s statewide stewardship planning and New York’s borough-level dispersal all address the same practical question: how can growing travel demand produce wider economic value without creating unnecessary pressure in the busiest places?
For airlines and airports, the model rewards capacity supporting timing and wider geographic access, although the strategies do not require route changes. Hawaii already shows how rising seat supply can coexist with lower daily visitor presence when stays become shorter. For travellers, destination stewardship can mean more promotion of secondary neighbourhoods, shoulder seasons, local experiences and less congested sites. For tourism businesses, the commercial signal is clear: visitor value, satisfaction and community acceptance are becoming important performance measures. The broader US tourism 2026 trend is therefore about managing demand more precisely, not simply choosing between tourism growth and tourism restriction.
| Destination | Latest verified indicator | Visitor distribution and local economic strategy | Travel and airline relevance |
|---|---|---|---|
| Hawaii | 5.92m visitors Jan–Jul 2026; $13.63bn spending | Resident sentiment, shoulder-season travel, hotspot management and island-level destination plans | July transpacific seats +6.1% YoY |
| Oʻahu | $9.42bn visitor spending in 2025; arrivals down 1.99% | Hotspot management and resident sentiment measurement | Encourages distribution beyond heavily used visitor areas |
| Maui | $5.97bn visitor spending in 2025, +12.7% | Community-first destination management | Helps align recovery, visitor experience and local priorities |
| Colorado | $29.2bn spending; 96.8m visitors in 2025 | Regional destination development and tourism management grants | Broadens travel demand beyond the Denver region |
| New York City | More than 1m visitors to NY–NJ region during 2026 World Cup | Five-borough events, neighbourhood discovery and local-business programmes | Uses major travel demand to stimulate neighbourhood movement and spending |
| United States | 70.5m international visitors forecast for 2026 | Greater need for destination-level visitor management | Supports continued inbound aviation and accommodation demand |
Hawaii and more are leading a US tourism shift toward resident benefits, smarter growth and visitor dispersal because destination performance is increasingly being measured through economic value, community acceptance, visitor experience and where tourism benefits are distributed. Hawaii provides the strongest 2026 example, combining rising visitor expenditure with resident-sentiment KPIs, hotspot management and increasing air capacity. Colorado is pairing a $29.2 billion travel economy with statewide stewardship, while New York has demonstrated how major events can direct visitors towards neighbourhood businesses. With US international arrivals forecast to keep growing, the emerging model favours better-managed tourism rather than unrestricted volume or broad visitor restrictions.
The US destinations, particularly Hawaii, are shifting their discussions from growth in arrivals to where, when and how they are coming. Hawaii is adopting an innovative approach to allocating tourism across the islands via resident sentiment, spending habits, demand during the shoulder seasons and hotspot management. Beyond its top tourist attractions, Colorado is also marketing its region to other tourist hot spots, and New York is expanding its ability to draw spending from tourists beyond the borough’s primary attractions through borough-wide tourism initiatives and activities in local neighbourhoods. The future of US tourism management will rely more and more on geographic distribution, seasonal balance and better links between tourism demand and local businesses, as international travel to the United States is expected to continue growing.
Advertisement
Advertisement
Advertisement












Tuesday, September 1, 2026

Tuesday, September 1, 2026

Tuesday, September 1, 2026

Tuesday, September 1, 2026

Tuesday, September 1, 2026

Tuesday, September 1, 2026

Tuesday, September 1, 2026