
Greece Tourism Receipts Rise Despite Lower Per-Trip Spending as Spain and Others Show Contrasting Trends

Updated
Published
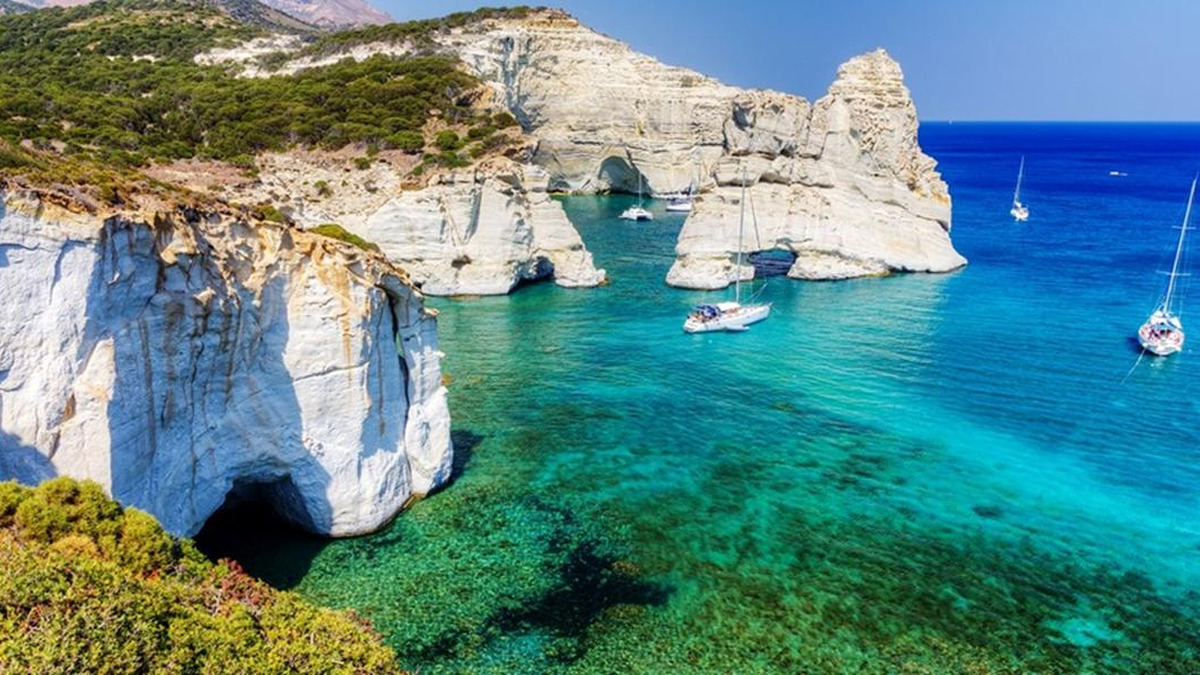
Greece’s tourism receipts increased by 6.5% in August 2026, although inbound traveller flows rose 13.4% and average spending per trip fell 6.5%. Official data from Spain, Portugal, Italy, Türkiye and France show why visitor numbers alone cannot measure tourism performance. Their commonality is inbound spending, but demand and revenue move differently. For travel companies, booking value matters as much as visitor counts.
Greece’s August Tourism Receipts Expose the Difference Between Volume and Value
According to the Bank of Greece, international travel receipts reached €4.867 billion in August, compared with €4.569 billion a year earlier. Inbound traveller flows totalled 8.466 million, up 13.4%. However, average expenditure per trip declined 6.5%. More people visited the country, but the corresponding rise in receipts was substantially smaller.
Across January–August, receipts reached €18.198 billion, up 9.4%, and arrivals rose 10% to 28.509 million. Average expenditure per trip over the eight months was nearly unchanged, so August alone does not establish a sustained decline.
The travel-services surplus stood at €4.381 billion in August and €15.420 billion over January–August.
Advertisement
Advertisement
Road Arrivals, Source Markets and Visitor Mix Change the Picture
Greek airport traveller flows grew 4.9% in August, while road-border flows jumped 32.2%. That does not establish whether road visitors caused the lower spending average. The bank also excludes most cruise passengers from its inbound-flow count unless captured by its Border Survey.
France and Italy provide a more revealing contrast within Greece’s own data. French arrivals fell 6.1% to 423,300, yet receipts from French residents rose 16.2% to €307.5 million. Italian arrivals increased 17.5% to 652,200, while receipts from Italian residents advanced 31.3% to €428.2 million. Both source markets illustrate why visitor and revenue changes should be examined together.
Advertisement
Advertisement
Official Tourism Revenue Dashboard Shows Six Different Market Conditions
These latest available official releases are not a harmonised ranking.
| Country | Period | Official expenditure or revenue indicator | Demand or spending context |
|---|---|---|---|
| Greece | August 2026 | €4.867bn travel receipts, +6.5% | Inbound flows +13.4%; spending per trip −6.5% |
| Spain | August 2026 | €17.838bn international tourist expenditure, +9.2% | Tourists +9.2%; expenditure per tourist unchanged |
| Portugal | August 2026 | €4.4bn travel-and-tourism receipts, +2.0% | Accommodation guests +1.9%; nights +1.7% |
| Italy | July 2026 | €8.3bn spent by foreign travellers, +6.8% | Inbound receipts outpaced outbound travel spending |
| Türkiye | April–June 2026 | US$15.865bn tourism income, −2.6% | Departing visitors −5.1%; overnight spending US$113 |
| France | January–June 2026 | €40bn international tourism receipts, +7.0% | July receipts separately rose 3.7% to €9.4bn |
Comparability note: The periods, currencies and visitor definitions vary. Portugal’s accommodation guest count includes domestic guests; Türkiye’s total includes receipts from international transfer passengers. No valid cross-country spending-per-tourist ranking can be calculated from these headline figures alone.
Advertisement
Advertisement
Spain’s Tourism Spending Growth Matches Its August Arrival Surge
According to Spain’s National Statistics Institute expenditure survey, international tourists spent €17.838 billion in August, 9.2% more than a year earlier. Its separate border survey counted 12.256 million international tourists, also up 9.2%. Average expenditure per tourist remained at €1,455, essentially unchanged year on year.
Daily spending rose 1.9% to €202, but average trip duration fell 1.9% to 7.2 days. Spain therefore differed from Greece’s August drop in expenditure per trip.
January–August expenditure in Spain reached €99.892 billion, up 8%, against 70.362 million tourist arrivals, up 5.4%. Accommodation accounted for 20.7% of August tourist spending, organised packages for 18.5% and activities for 18.4%. The figures show spending extends well beyond hotel rooms.
Business-purpose tourism expenditure reached €373 million in August, 14.5% higher year on year. This is not a direct measure of meetings and events revenue.
Advertisement
Advertisement
Portugal’s Receipts Increase While Accommodation Demand Moves More Slowly
According to Turismo de Portugal’s 20 October tourism outlook, travel-and-tourism receipts reached €4.4 billion in August, 2% above the corresponding month of 2025. France accounted for 19.6% of receipts, followed by the United Kingdom at 13.7% and Spain at 13.6%.
Tourist accommodation establishments recorded 3.9 million guests, up 1.9%, and 10.9 million overnight stays, up 1.7%. From January to August, accommodation providers registered 22.4 million guests and 57.3 million nights. Among major foreign markets, Canada, the United States and Spain recorded particularly strong August growth in overnight stays.
Domestic guests are included in accommodation figures, so those totals cannot provide an international spending-per-visitor measure. Separating occupancy, room yield and spending elsewhere requires consistent statistics.
Italy’s Foreign Visitor Spending Grows Faster Than Italians’ Overseas Expenditure
According to the Banca d’Italia international tourism survey, foreign travellers spent €8.3 billion in Italy during July, up 6.8% year on year. Italian travellers spent €3.6 billion abroad, an increase of 1.5%. The monthly travel balance recorded a €4.7 billion surplus.
During the three months ending in July, inbound spending rose 5.5%, compared with 2.1% growth in outbound spending. Inbound expenditure by non-EU residents increased 6.8%, exceeding the 4.4% growth recorded among EU residents over that three-month period.
Banca d’Italia combines border interviews, traveller counts and administrative records. These expenditure statistics are not hotel-only revenue.
Advertisement
Advertisement
Türkiye’s Tourism Income Falls Less Sharply Than Visitor Numbers
According to the Turkish Statistical Institute’s second-quarter release, Türkiye earned US$15.865 billion from tourism during April–June 2026, down 2.6% on the same period last year. Departing visitor numbers declined 5.1% to 15.581 million. The average overnight expenditure of visitors staying at least one night was US$113, compared with US$110 a year earlier.
Tourism income from visitors totalled US$15.656 billion, with a further US$209.5 million from international transfer passengers. Individual expenditure generated US$10.934 billion; package tours generated US$4.722 billion. The total therefore differs from spending by overnight visitors alone.
Package-tour spending represented 30.2% of visitor-generated income, food and drink 21%, international transport 12.4% and accommodation 11.3%. Accommodation expenditure increased 11.7%, even as package spending declined 5.5%. The contrast exposes uneven sector performance. The next quarterly tourism-statistics release was scheduled for 30 October, beyond this report’s cut-off date.
France’s International Tourism Receipts Rise as Travel Budgets Remain Selective
According to the public tourism-development agency Atout France, international receipts reached €40 billion in the first half of 2026, up 7% year on year. The travel-account surplus increased 23% to €14.4 billion. July brought another €9.4 billion in international receipts, 3.7% above July 2025.
July expenditure from British residents increased 13%, German receipts rose 9% and Dutch receipts grew 6%. Source-market differences complicate regional comparisons.
A separate French holidaymaker survey published through Atout France indicated that some residents changed their summer spending habits: 17% reduced restaurant outings, 15% curtailed activities and 14% reduced shopping. These figures concern French travellers, not inbound receipts, and must be analysed separately.
Advertisement
Advertisement
Independent Analysis Reveals Why Tourism Volume Is Not Visitor Value
The distinctive finding across these releases is not that one destination is more efficient than another. It is that growing visitor demand can produce several different financial outcomes. In Greece, August arrival growth exceeded receipt growth by 6.9 percentage points. In Spain, the two August growth rates were both 9.2%, although average daily expenditure rose and trip length shortened. In Türkiye, the quarterly reduction in income was less severe than the decline in departing visitors.
These patterns should change how commercial teams interpret performance. Revenue per trip, revenue per night and hotel revenue per available room answer different questions. A shorter stay can reduce trip-level expenditure despite stronger daily spending. A rise in hotel takings may coexist with weaker package income. Changes in visitor origin can also alter national averages without proving that individual travellers have cut budgets.
The most useful next step is to compare matched months, currencies, market segments and visitor definitions. Operators should then separate accommodation, transport, activities and packaged services. Only that approach can reveal whether revenue growth reflects higher prices, longer stays, greater sales of experiences or simply a larger customer base. These are analytical implications of the official releases, not findings of a coordinated government investigation.
What the Tourism Spending Divide Means for Travellers and Businesses
For travellers, lower average expenditure per trip does not establish that Greece has become cheaper, just as Spain’s higher daily expenditure does not prove every visitor faces higher prices. Holiday costs depend on dates, destination, trip duration and the services included in a booking. Travellers comparing Mediterranean itineraries should assess total costs rather than assume national averages describe an individual holiday.
For airlines, hotels, travel agents and destination-management companies, the evidence favours more precise segmentation. France’s contribution to Portuguese receipts, Italy’s growing contribution to Greek receipts and Spain’s spending mix offer different leads for product design. The releases establish no specific new route, hotel project or entry-rule change.
Operational Priorities for Travel Agents and Tour Operators
| Planning area | Recommended response | Risk to manage |
|---|---|---|
| Pricing | Track total package value and spending per traveller alongside booking volume | Mistaking rising arrivals for stronger margins |
| Capacity | Compare room nights, stays, load factors and shoulder-season demand | Overcommitting inventory using peak-month growth |
| Source markets | Review France, Italy, Spain and other origins separately | Missing divergent market-level performance |
| Product mix | Monitor accommodation, organised tours, activities and transport receipts | Assuming all tourism subsectors grow together |
Key operational takeaways include:
Advertisement
Advertisement
- Use matching reporting periods before comparing destinations or setting sales targets.
- Keep euros and US dollars separate unless exchange-rate methods and dates are specified.
- Confirm whether a statistic covers overnight tourists, same-day visitors, transfer passengers or accommodation guests.
- Build flexible packages with clear inclusion lists and independently verified transport arrangements.
- Monitor later official releases for revisions before changing winter or 2027 capacity commitments.
Outlook for Tourism Revenue and International Travel in 2027
The wider strategic implication is a transition from headline arrival growth towards closer scrutiny of yield, trip duration and spending composition. Greece’s August figures make that issue immediately visible, but Spain, Portugal, Italy, Türkiye and France show that the pattern is neither universal nor uniform. In the next reporting cycle, comparable measures of revenue per visitor and per night will be essential for assessing destination competitiveness, tourism investment and the resilience of international travel demand.
FAQs
Why did Greece’s tourism receipts rise when expenditure per trip fell?
Because the 13.4% increase in August inbound traveller flows more than offset the 6.5% decline in average expenditure per trip, producing 6.5% higher total receipts.
Which six countries are covered by this tourism spending analysis?
Greece, Spain, Portugal, Italy, Türkiye and France. Their common connection is international visitor expenditure and the relationship between revenue, visitor volumes and trip characteristics.
Does Spain’s higher average daily spending mean tourists spend more per holiday?
Not necessarily. August daily expenditure increased 1.9%, but average trip duration fell 1.9%, leaving expenditure per tourist broadly unchanged at €1,455.
Are the six countries participating in an official tourism investigation?
No coordinated six-country investigation was identified in the official releases. This is an independent comparison of national tourism statistics reported for different periods.
What should tour operators monitor next?
Track receipts, arrivals, stays, room yield, package revenue and revisions. Türkiye’s next release was scheduled for 30 October and Greece’s for 23 November 2026.
Advertisement
