
Mexico City Joins Bengaluru and More as Traffic-Challenged Destinations Test Global Tourists’ Travel Plans

Updated
Published
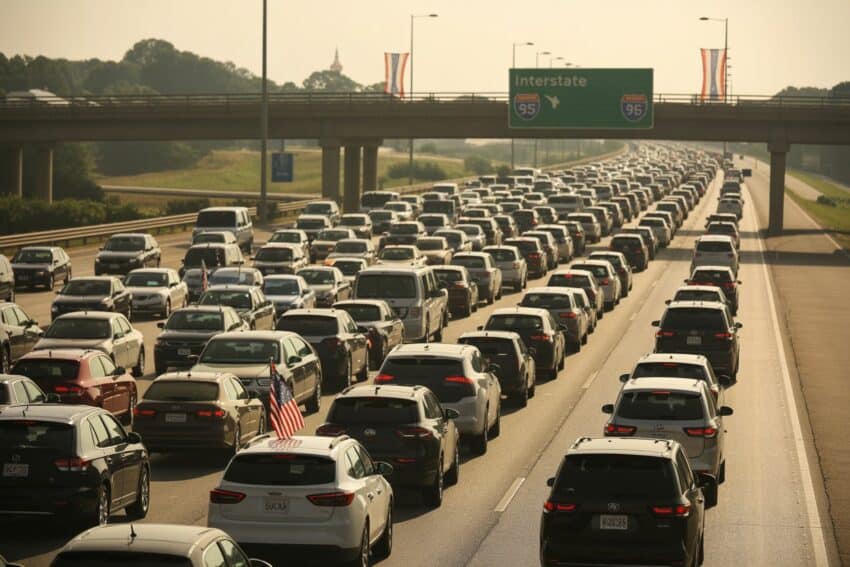
Image generated with Ai
Mexico City, Bengaluru and more destinations are putting traffic firmly on the travel radar as global tourists rethink their travel plans. From Mexico City traffic to Bengaluru congestion, busy roads can quickly reshape a city break. Moreover, traffic-challenged destinations can turn short journeys into lengthy transfers, affecting sightseeing, dining and airport schedules. However, smarter planning can help travellers navigate these cities more comfortably. Mexico City and Bengaluru remain packed with attractions despite demanding road conditions. Meanwhile, more traffic-challenged destinations are attracting global tourists seeking culture, food and unforgettable experiences. Travel And Tour World urges travellers to read the entire story for essential travel insights, practical planning tips and destination guidance.
The global traffic picture travellers need to know
Mexico City is not simply a large destination with occasional congestion. The latest 2025 TomTom Traffic Index places it first globally for congestion level, with a reading of 75.9%. The figure was 3.6 percentage points lower than in 2024, yet the city still occupied the top position.
Advertisement
Advertisement
TomTom calculated its 2025 results from worldwide trip data covering more than 3.65 trillion kilometres. The methodology uses anonymised GPS information and actual driving speeds across metropolitan and central-city road networks.
For Mexico City, a 10-kilometre journey averaged 34 minutes 29 seconds in 2025. That was 58 seconds longer than the previous year. The average distance covered in 15 minutes was only 4.4 kilometres.
Advertisement
Advertisement
The difference becomes more significant during commuting periods. A 10-kilometre journey during the morning rush took approximately 41 minutes 40 seconds, while the evening equivalent reached 47 minutes 15 seconds. Average rush-hour speeds were approximately 14.4 km/h in the morning and 12.7 km/h in the evening.
TomTom estimates that motorists lost 184 hours, equivalent to seven days and 16 hours, because of rush-hour congestion during 2025. That was 1 hour 16 minutes less than the previous year.
Advertisement
Advertisement
The worst recorded day was 28 May 2025. The average congestion level reached 117%, while the 3 p.m. figure reached 167%. Only about 2.6 kilometres could be covered during a 15-minute journey at that point.
For international tourists, these numbers matter because airport transfers, sightseeing, restaurant reservations and intercity connections can all depend on road travel.
Advertisement
Advertisement
Mexico City tourism remains substantial despite the traffic challenge
Mexico City’s traffic story needs to be considered alongside its enormous tourism activity.
Official Mexico City tourism statistics show 6.864 million hotel tourists in 2021, followed by 11.900 million in 2022, 14.403 million in 2023 and 14.848 million in 2024.
The latest city government reporting says that Mexico City welcomed more than 15 million tourists and 62.3 million visitors during 2025. Tourism spending reached approximately 159 billion Mexican pesos.
The distinction between tourists and visitors is important. Hotel tourists represent people recorded through accommodation statistics, while the wider visitor figure includes people who may visit the capital without staying in hotels.
Advertisement
Advertisement
Mexico City tourism statistics
| Year | Hotel tourist arrivals | Hotel occupancy | Hotel-tourist spending |
|---|---|---|---|
| 2021 | 6.864 million | 33.5% | MXN 63.546 billion |
| 2022 | 11.900 million | 57.5% | MXN 110.786 billion |
| 2023 | 14.403 million | 63.6% | MXN 132.854 billion |
| 2024 | 14.848 million | 64.2% | MXN 141.375 billion |
| 2025 | More than 15 million tourists* | — | MXN 159 billion total tourism spending* |
*2025 figures reported by the Mexico City government use broader tourism indicators and are not perfectly equivalent to the annual hotel-arrival series above.
The five-year comparison shows how strongly tourism recovered after the pandemic disruption. Hotel arrivals more than doubled between 2021 and 2024, increasing from 6.864 million to 14.848 million.
The city also recorded 9.751 million hotel tourists during January-August 2025, 5.3% above the corresponding 2024 period. Hotel-tourist spending reached approximately MXN 101.068 billion during those eight months.
Mexico City: detailed traffic statistics for travellers
| Indicator | 2025 figure |
|---|---|
| Global congestion position | 1 |
| Average congestion | 75.9% |
| Change from 2024 | -3.6 percentage points |
| Average 10-km journey | 34 min 29 sec |
| Average distance in 15 minutes | 4.4 km |
| Morning 10-km journey | 41 min 40 sec |
| Evening 10-km journey | 47 min 15 sec |
| Morning rush speed | 14.4 km/h |
| Evening rush speed | 12.7 km/h |
| Rush-hour time lost annually | 184 hours |
| Worst day | 28 May 2025 |
| Worst-day congestion | 117% |
| 3 p.m. congestion on worst day | 167% |
| Distance in 15 minutes at 3 p.m. | 2.6 km |
| Highway trip share | 21.2% |
| Average highway speed | 31.7 km/h |
Source: TomTom Traffic Index 2025.
How travellers should redesign a Mexico City itinerary
The official Mexico City tourism authority recommends using the city’s Integrated Mobility Network and provides dedicated one-day, three-day and seven-day itineraries.
That advice becomes especially useful when road congestion is high.
Advertisement
Advertisement
A traveller staying in Roma or Condesa can concentrate several activities within those neighbourhoods instead of crossing the city repeatedly. Visitors staying near the historic centre can combine Zócalo, Templo Mayor, Alameda Central and nearby museums.
The official tourism guide specifically highlights the Historic Centre, Chapultepec, Roma, Condesa, Polanco, Coyoacán and University City among areas worth exploring.
This neighbourhood-based approach is particularly useful for visitors with limited time.
Mexico City public transport is central to the travel strategy
The city operates an Integrated Mobility Network covering several modes of public transportation. The official tourism portal directs travellers towards the network map when planning journeys.
The Metro is particularly useful for travellers who want to avoid depending completely on road traffic.
The key strategy is not necessarily to eliminate road travel. Instead, tourists can combine rail, walking and other public transportation with occasional taxis or private transfers.
Advertisement
Advertisement
Airport journeys deserve additional caution because missing a flight creates much greater consequences than arriving late for a museum visit.
Travellers should also avoid scheduling two attractions in distant parts of the metropolitan area within tightly connected time slots.
Other Global Tourist Cities Facing Severe Traffic
The 2025 TomTom results show that Mexico City is only one part of a much wider urban mobility challenge. Bengaluru, Dublin, Łódź, Pune, Lublin, Bogotá, Arequipa, Lima and Bangkok also appear among the ten cities with the highest congestion levels in the index.
Bengaluru, India
Bengaluru ranks second globally by congestion level, recording 74.4% in the 2025 TomTom Traffic Index. Its congestion level increased by 1.7 percentage points compared with 2024. The city recorded 168 hours of rush-hour time lost, while average speeds during busy periods remained extremely low.
For travellers, Bengaluru presents an unusual combination of technology, heritage, gardens, food and heavy road congestion. The official Incredible India tourism portal recommends beginning early at Lalbagh Botanical Garden, followed by historic and cultural sites. Bangalore Palace, Tipu Sultan’s Summer Palace, Bull Temple, Cubbon Park and Basavanagudi are among the city’s key attractions.
A practical three-day itinerary should group attractions by area. Start around Lalbagh and Basavanagudi, then explore central heritage locations on another day. Keep the third day for Cubbon Park, Bangalore Palace and shopping areas. Travellers should leave additional time for journeys between the airport, hotel and sightseeing areas.
Advertisement
Advertisement
Food is another reason to explore Bengaluru. Official tourism material highlights dosa, ragi-based dishes, idli, Mysore Pak and Karnataka-style meals. Visitors can concentrate dining around neighbourhoods they are already exploring rather than making additional cross-city journeys.
For accommodation, central areas around MG Road, Church Street, Indiranagar and the central business districts can make sightseeing more manageable. The key travel principle is simple: stay near the areas you intend to explore most.
Dublin, Ireland
Dublin ranks third globally for congestion at 72.9%. TomTom data places the city among the world’s most congested urban areas, while its annual rush-hour time lost reached 191 hours, higher than Mexico City’s 184 hours.
The traffic challenge is particularly relevant because Dublin’s most important visitor attractions are concentrated around a relatively compact central area. The official Dublin tourism information highlights Trinity College and the Book of Kells, Guinness Storehouse, Christ Church Cathedral, Dublin Castle and Phoenix Park.
This gives tourists an opportunity to reduce road exposure by building walking-heavy days. A first day can focus on Trinity College, Grafton Street, Dublin Castle, Christ Church and nearby museums. A second day can cover Guinness Storehouse and Phoenix Park. A third day can combine museums, neighbourhood exploration and coastal experiences.
Fáilte Ireland recorded 4.1 million overseas tourists visiting Dublin during 2024, generating €2.4 billion in revenue. Domestic tourism added another 2.8 million visitors, while Northern Ireland contributed 276,000 visitors.
Advertisement
Advertisement
The same official tourism research found that overseas tourists stayed an average of 4.8 nights in Dublin and spent an average of €582 per person. Hotels accounted for 64% of overseas holidaymaker bednights.
Food planning can also remain local. Dublin’s official city information highlights seafood, pub food, markets, international cuisine and the city’s established restaurant scene.
For accommodation, central Dublin provides easier access to major attractions, while areas around the city centre and Docklands can suit travellers who want transport connections and restaurants nearby.
Łódź, Poland
Łódź recorded a 72.8% congestion level in the 2025 TomTom Index, placing it fourth globally. Average annual rush-hour time lost reached approximately 135 hours, according to the reported index data.
For tourists, the Polish city offers a different experience from Europe’s more heavily visited capitals. Its industrial heritage, renovated factory complexes, long urban avenues and creative districts provide a strong cultural itinerary.
Piotrkowska Street should form the centre of a first visit because it acts as a major social, commercial and dining corridor. OFF Piotrkowska provides another useful stop for visitors interested in contemporary food and creative spaces. Official destination information describes Piotrkowska as stretching for more than four kilometres and serving as a major culinary spine.
Advertisement
Advertisement
A two-day itinerary can focus on central heritage and creative districts rather than repeatedly crossing the city. Day one can concentrate on Piotrkowska Street and nearby architecture. Day two can focus on former industrial areas, cultural venues and local restaurants.
Travellers should try traditional Polish dishes such as pierogi and żurek, while modern restaurants increasingly reinterpret regional ingredients.
Hotels and apartments around the city centre provide a practical base because they reduce the need for long road transfers.
Łódź is therefore particularly suitable for a slower cultural city break. Visitors can spend more time walking between central attractions and less time depending on taxis during congested periods.
Pune, India
Pune recorded a 71.1% congestion level in 2025, placing it fifth globally. The city recorded an estimated 152 hours lost during rush hour, while its congestion level increased by 5.4 percentage points from 2024, according to TomTom’s India data.
Pune combines Maratha history, educational institutions, food culture and nearby mountain landscapes. Official Incredible India material highlights Shaniwar Wada, Aga Khan Palace, Lal Mahal, Sinhagad Fort, Dagdusheth Halwai Ganapati Temple and several historic caves and forts.
Advertisement
Advertisement
Traffic makes sequencing particularly important. A traveller can dedicate one day to central heritage, another to food and neighbourhood exploration, and a third to a nearby fort or countryside experience.
For food, visitors should try misal pav, vada pav, pithla bhakri, bhel puri, puran poli and Shrikhand. The official tourism portal also highlights FC Road, JM Road, Tulshibaug and Mandai as useful food and market areas.
Travellers staying around central Pune can reduce repeated journeys. Koregaon Park and Camp provide additional dining and accommodation choices.
October through February is identified by Incredible India as a favourable period for exploring Pune because temperatures are generally more comfortable. The same tourism guidance cautions that monsoon conditions from June through September can affect outdoor plans.
A sensible itinerary therefore combines central sightseeing with one carefully planned excursion instead of multiple long-distance journeys every day.
Lublin, Poland
Lublin ranks sixth globally in the 2025 congestion data, with a 70.4% congestion level and approximately 117 hours of rush-hour time lost.
Advertisement
Advertisement
The city is much smaller than Mexico City or Bengaluru, which makes its appearance on the congestion list particularly relevant to travellers. Even comparatively compact destinations can experience substantial delays when road capacity and traffic volumes interact.
Lublin is best explored through a concentrated historic-centre itinerary. Travellers can focus on the Old Town, castle area, pedestrian streets and cultural institutions during a first day. A second day can explore museums, local neighbourhoods and regional food.
The compact nature of the central area means walking can reduce dependence on road transport. Travellers staying near the historic centre can make this approach even easier.
Traditional Polish food should be part of the visit, with regional dishes and bakery products providing simple opportunities to experience local culture. Restaurants around the central districts can also reduce unnecessary transfers.
For a two- or three-night trip, the best approach is to avoid building an itinerary around attractions scattered across the metropolitan area. Instead, visitors can treat the historic core as their base and use public transport or taxis selectively.
The city also works well as part of a broader eastern Poland itinerary. However, travellers connecting through several destinations should allow generous buffers because a delayed urban transfer can affect trains and other scheduled connections.
Advertisement
Advertisement
Bogotá, Colombia
Bogotá recorded a 69.6% congestion level in the 2025 TomTom data, ranking seventh globally. Rush-hour traffic accounted for approximately 153 hours of lost time. Average travel speed was around 18.9 km/h.
The city remains a major tourism destination. Bogotá’s official tourism authorities reported more than 14 million tourists during 2024. Cultural, historical and architectural activities represented 73.2% of plans among international tourists, while gastronomy accounted for 62.1% and nature experiences 54.2%.
That visitor profile provides a useful itinerary structure.
Begin around La Candelaria and Plaza de Bolívar. Continue towards the Gold Museum and other nearby cultural attractions. Another day can focus on Monserrate, while a third day can explore gastronomy and neighbourhoods.
Bogotá’s official tourism guide includes 103 attractions and 39 routes, organised around culture, nature, entertainment, gastronomy, shopping and major events.
Food should be central to the experience. Travellers can explore traditional Colombian dishes, local markets and the city’s restaurant districts. The official tourism authorities also highlight gastronomic areas such as Zona G, La Candelaria and Usaquén.
Advertisement
Advertisement
Bogotá currently operates five tourist information points, including locations at El Dorado Airport, Monserrate, the Botanical Garden, Centro Internacional and Plaza de Bolívar. These provide visitors with information about attractions, food, accommodation and mobility.
For accommodation, La Candelaria suits heritage-focused trips, while northern neighbourhoods can provide access to restaurants and modern hotels.
Arequipa, Peru
Arequipa appears eighth in the reported 2025 TomTom global congestion table, with congestion around 69.5% and approximately 154 hours of rush-hour time lost.
The city is a compelling example of why traffic planning should not be restricted to enormous megacities. Arequipa’s historic core offers a concentrated sightseeing experience, allowing travellers to reduce road journeys by staying centrally.
Visitors can focus on the historic centre, architectural landmarks, museums, viewpoints and local food experiences before planning excursions farther outside the city.
A sensible three-day itinerary can place central heritage attractions on day one. Day two can focus on museums, markets and gastronomy. Day three can be reserved for a longer excursion, depending on current transport conditions and weather.
Advertisement
Advertisement
Food is an important part of the Arequipa experience. Travellers can look for regional dishes and traditional Peruvian cuisine in established local dining areas.
Accommodation close to the historic centre can reduce transfer times. Visitors should be particularly cautious about scheduling an early airport departure immediately after a late-night activity because urban traffic can make journey estimates unreliable.
The destination also works well for travellers combining cultural sightseeing with nature experiences.
The key lesson from Arequipa’s position in the congestion ranking is that visitors should not assume smaller destinations automatically mean faster travel. Road conditions can change significantly according to time, location and local traffic patterns.
Lima, Peru
Lima recorded a 69.3% congestion level in the 2025 TomTom data and approximately 195 hours of rush-hour time lost, placing it ninth in the reported global ranking.
For travellers, Lima is particularly important because it is both a destination and a major gateway for exploring Peru.
Advertisement
Advertisement
A first visit can be organised around the historic centre, museums and architectural landmarks. Another day can focus on Miraflores and the Pacific coastline. Barranco offers a separate experience centred on art, architecture, restaurants and nightlife.
Because these districts are separated geographically, travellers should avoid trying to visit every area in a single day.
Food deserves its own space in the itinerary. Lima is internationally recognised for Peruvian cuisine, and visitors can explore ceviche, causa, anticuchos and other regional dishes.
Accommodation should be selected according to the traveller’s itinerary. Miraflores and Barranco can work well for visitors focusing on restaurants, coastal experiences and contemporary city life, while central accommodation may suit heritage-focused trips.
Airport transfers require additional planning. Lima’s road congestion can turn what looks like a straightforward journey into a much longer transfer.
Travellers connecting to domestic flights should therefore avoid relying on minimum transfer windows when road transport is involved.
Advertisement
Advertisement
A three-day Lima itinerary can work effectively when each day focuses on a defined zone. This approach reduces unnecessary cross-city travel while leaving more time for museums, food and neighbourhood exploration.
Bangkok, Thailand
Bangkok completes the reported top ten, with a 67.9% congestion level in the 2025 TomTom figures. Approximately 115 hours were lost during rush hours, while the average distance covered in 15 minutes was about 6.5 kilometres according to the reported ranking data.
Bangkok’s tourism appeal is broad, ranging from temples and palaces to markets, shopping districts and street food.
Traffic planning is particularly important because visitors often combine attractions spread across the Chao Phraya river area, historic districts and modern commercial neighbourhoods.
The Bangkok Metropolitan Administration’s official tourism platform provides route and travel-planning information for visitors.
A first day can focus on the historic area and major temples. Another day can concentrate on riverside experiences. A third can cover markets, shopping and food.
Advertisement
Advertisement
Travellers should consider using public transport and river connections where practical rather than depending entirely on cars.
Food is central to the Bangkok experience. Visitors can explore local markets, traditional Thai dishes, noodles, curries, grilled foods and desserts.
Accommodation near a convenient transport connection can make a substantial difference. Sukhumvit, Siam and riverside areas provide different styles of access, while the best choice depends on the attractions included in the itinerary.
Bangkok is therefore another example of a city where choosing the right base can be as important as choosing the right attractions.
Global Congestion Comparison for Travellers
| Global position | City | Country | Congestion | Rush-hour time lost | Approx. distance in 15 min |
|---|---|---|---|---|---|
| 1 | Mexico City | Mexico | 75.9% | 184 hrs | 4.4 km |
| 2 | Bengaluru | India | 74.4% | 168 hrs | 4.2 km* |
| 3 | Dublin | Ireland | 72.9% | 191 hrs | 4.4 km* |
| 4 | Łódź | Poland | 72.8% | 135 hrs | 5.6 km* |
| 5 | Pune | India | 71.1% | 152 hrs | 4.5 km* |
| 6 | Lublin | Poland | 70.4% | 117 hrs | 6.8 km* |
| 7 | Bogotá | Colombia | 69.6% | 153 hrs | 4.7 km* |
| 8 | Arequipa | Peru | 69.5% | 154 hrs | 4.5 km* |
| 9 | Lima | Peru | 69.3% | 195 hrs | 4.3 km* |
| 10 | Bangkok | Thailand | 67.9% | 115 hrs | 6.5 km* |
*Figures in the broader ranking table are reported from the 2025 TomTom dataset; city-specific methodology and display settings can vary. Mexico City’s detailed city page provides the most granular figures used above.
Five-Year Tourism Comparison: What the Official Data Shows
A critical point for publishing accurate travel statistics is that there is no single standard five-year visitor dataset covering all ten cities. Each tourism authority defines visitors differently, and several cities publish hotel arrivals, international arrivals or total visits rather than one unified visitor measure.
Advertisement
Advertisement
Mexico City
| Year | Official hotel tourist arrivals |
|---|---|
| 2021 | 6.864 million |
| 2022 | 11.900 million |
| 2023 | 14.403 million |
| 2024 | 14.848 million |
| 2025 | More than 15 million tourists |
Mexico City’s official tourism data provides the clearest continuous series among the destinations examined.
Dublin
| Year | Officially identified tourism data |
|---|---|
| 2021 | Pandemic-disrupted year; not directly comparable |
| 2022 | Recovery year; methodology varies by dataset |
| 2023 | Official tourism datasets available |
| 2024 | 4.1m overseas + 2.8m domestic + 276k Northern Ireland visitors |
| 2025 | Full comparable annual figure not established in the source reviewed |
Fáilte Ireland’s 2024 Dublin report records 7.176 million visitors across the three reported categories, although these categories should not automatically be treated as equivalent to a single global tourist-arrival measure.
Bogotá
| Year | Official tourism information available |
|---|---|
| 2021 | Pandemic-affected |
| 2022 | Recovery data published through tourism observatory |
| 2023 | Tourism Observatory data available |
| 2024 | More than 14 million tourists |
| 2025 | 6.61m international tourists Jan-Oct |
Bogotá recorded 6.61 million international tourists between January and October 2025 and expected an additional 2.01 million international visitors by year-end.
New York City — useful global comparison
New York City is not in the 2025 top-ten congestion list above, but it demonstrates why tourism volume and congestion should be examined together.
| Year | Total visitors |
|---|---|
| 2021 | ~33 million |
| 2022 | ~56 million |
| 2023 | 62.2 million |
| 2024 | Nearly 65 million |
| 2025 | 68 million forecast |
The New York City government reported 62.2 million visitors in 2023, nearly 65 million in 2024 and a forecast of 68 million for 2025.
The comparison demonstrates an important travel principle: a city can handle enormous visitor volumes without having the same congestion profile as another destination, because transport networks, visitor geography, modal choices and road usage differ.
Advertisement
Advertisement
Five-Year Mexico City Tourism Trend
| Year | Hotel arrivals | Change from previous year |
|---|---|---|
| 2021 | 6.864m | — |
| 2022 | 11.900m | +73.4% |
| 2023 | 14.403m | +21.0% |
| 2024 | 14.848m | +3.1% |
| 2025 | >15m reported | Continued recovery |
The 2022 recovery was especially pronounced, while the pace moderated considerably by 2024. Official statistics show hotel arrivals rising from 6.864 million in 2021 to 14.848 million in 2024.
The city government’s 2026 reporting subsequently stated that more than 15 million tourists visited during 2025 and that total visitors reached 62.3 million.
What Travellers Can Learn From the Global Traffic Data
The figures point to several practical lessons for international tourists.
First, do not calculate city journeys purely by kilometres.
A 10-kilometre trip in Mexico City averaged 34 minutes and 29 seconds in 2025. During the evening rush, the same distance averaged 47 minutes and 15 seconds.
Second, choose accommodation strategically.
Advertisement
Advertisement
A hotel close to the attractions a traveller wants to see can reduce repeated journeys.
Third, group attractions geographically.
This is particularly valuable in Mexico City, Bengaluru, Bogotá, Lima and Bangkok.
Fourth, protect airport-transfer time.
Airport journeys should have larger buffers than ordinary sightseeing trips.
Fifth, use public transportation where it makes sense.
Advertisement
Advertisement
Mexico City’s official tourism portal explicitly directs visitors toward the Integrated Mobility Network.
Finally, keep the itinerary flexible.
Traffic can change because of weather, roadworks, events, accidents and commuting patterns. TomTom’s methodology itself recognises that dynamic factors can influence actual travel times.
Detailed Traveller Planning Table
| Destination | Main traffic concern | Recommended strategy | Key sightseeing focus | Food focus | Suggested stay |
|---|---|---|---|---|---|
| Mexico City | Extremely high congestion | Metro + neighbourhood planning | Historic Centre, Chapultepec, Coyoacán, Roma, Condesa | Mexican regional cuisine, markets | Centro, Roma, Condesa, Polanco |
| Bengaluru | Severe rush-hour delays | Early starts + rail/public transport where practical | Lalbagh, Palace, Cubbon Park, Basavanagudi | Dosa, idli, ragi dishes, Mysore Pak | Central Bengaluru, MG Road, Indiranagar |
| Dublin | High congestion in compact urban area | Walking + public transport | Trinity, Guinness, Dublin Castle, Phoenix Park | Pub food, seafood, Irish cuisine | City centre, Docklands |
| Łódź | High congestion for city size | Stay central + walk | Piotrkowska, industrial heritage | Pierogi, żurek, modern Polish cuisine | Central Łódź |
| Pune | Heavy rush-hour conditions | Zone-based itinerary | Shaniwar Wada, Aga Khan Palace, forts | Misal pav, vada pav, puran poli | Central Pune, Koregaon Park |
| Lublin | High congestion despite smaller scale | Historic-centre base | Old Town, Castle, cultural sites | Polish regional food | Old Town/central districts |
| Bogotá | Major peak-period delays | TransMilenio/public transport + district planning | La Candelaria, Gold Museum, Monserrate | Colombian cuisine, gastronomy districts | La Candelaria or northern districts |
| Arequipa | Congestion affects transfers | Central base + planned excursions | Historic centre, museums, viewpoints | Arequipeño cuisine | Historic centre |
| Lima | Very high annual time loss | District-based sightseeing | Historic Centre, Miraflores, Barranco | Ceviche, causa, anticuchos | Miraflores, Barranco |
| Bangkok | Heavy metropolitan congestion | Rail + river transport + early starts | Temples, riverside, markets, shopping | Thai street food, local markets | Sukhumvit, Siam, riverside |
A Practical Seven-Day Multi-City Traffic-Aware Travel Philosophy
Travellers planning a multi-city holiday should not attempt to maximise the number of attractions visited each day.
A better approach is to allocate each day around one geographical cluster.
For Mexico City, spend one day in the historic core, another around Chapultepec and Reforma, and another around Roma, Condesa or Coyoacán.
Advertisement
Advertisement
For Bengaluru, begin early and concentrate on heritage and garden attractions before the busiest commuting periods.
For Dublin, walking between central attractions can substantially reduce dependence on road travel.
For Bogotá, combine La Candelaria attractions before moving to another district.
For Lima, keep Miraflores and Barranco together instead of crossing the city several times.
For Bangkok, combine rail and river transport with walking wherever practical.
The same principle applies to accommodation.
Advertisement
Advertisement
A slightly more expensive hotel in a strategically useful neighbourhood can potentially save significant journey time and transportation costs.
The Bigger Tourism Story Behind the Traffic Numbers
The traffic statistics should not be interpreted as a reason to remove these destinations from travel plans.
Instead, they provide valuable information for itinerary design.
Mexico City continues to receive millions of hotel tourists and tens of millions of wider visitors. Its 2025 tourism figures underline the destination’s enormous international and domestic appeal.
Bengaluru combines technology, heritage and food culture. Dublin offers historic attractions within a relatively concentrated central area. Bogotá combines culture, gastronomy and mountain landscapes. Bangkok brings together temples, markets, shopping and food.
The key difference for travellers is preparation.
Advertisement
Advertisement
A visitor who treats a congested megacity like a small walkable destination may lose hours.
A visitor who plans around neighbourhoods, transport connections and realistic journey times can create a much more manageable trip.
For global tourists, the latest traffic data therefore serves as a planning tool rather than simply a warning.
The world’s busiest tourist cities remain full of experiences. The smartest itineraries are those that account for the roads before the journey begins.
Conclusion
Mexico City, Bengaluru and more traffic-challenged destinations are reshaping how global tourists approach city travel. Heavy traffic can test travel plans, but it does not have to define the entire experience. Instead, travellers can plan around busy periods, choose convenient accommodation and use public transport where practical. Mexico City and Bengaluru continue to offer culture, cuisine, heritage and memorable experiences beyond their congested roads. Likewise, other traffic-challenged destinations reward visitors who prepare carefully. Therefore, global tourists can turn longer journeys into smoother adventures with smarter planning. Travel And Tour World encourages travellers to consider these practical insights before their next city escape.
Advertisement
