
Colorado Leads Arizona and Other States as Mountain Tourism Takes Centre Stage in America’s Dramatic Travel Transformation

Updated
Published
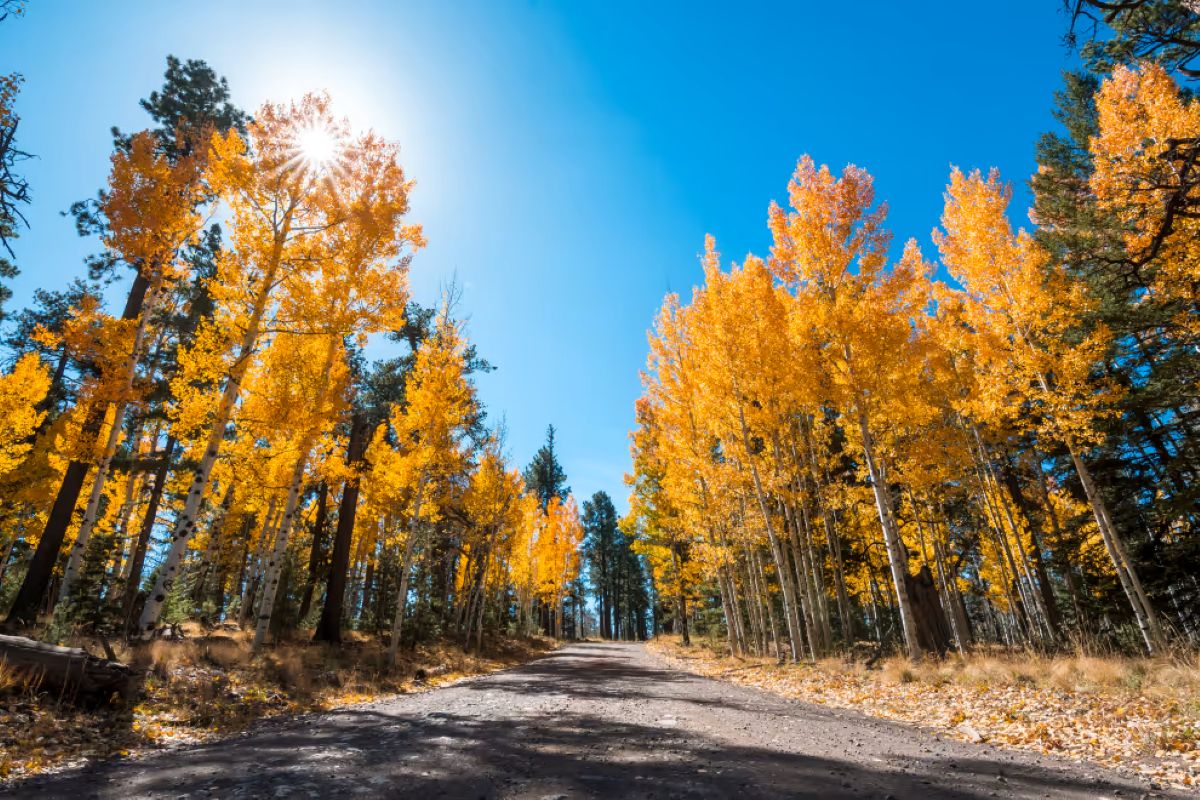
Arizona, Colorado, Idaho and Kansas are reshaping tourism across the United States by prioritising visitor spending, outdoor adventures, sports tourism and sustainable travel. According to the supplied tourism analysis, the four states collectively generated approximately $72.05 billion in direct visitor spending in 2025, with projections suggesting combined expenditure could reach $74.7 billion to $75.5 billion in 2026. Colorado leads in visitor volume, while Arizona remains a major destination for luxury resorts, desert tourism and cultural experiences. Idaho is expanding its adventure tourism economy through wilderness attractions and improved air connectivity. Meanwhile, Kansas is strengthening its position through sports tourism, prairie heritage and opportunities associated with the 2026 FIFA World Cup. Together, these developments highlight a shift towards longer stays, rural tourism growth and stronger economic benefits for local communities.
Comparative Tourism Overview: 2025–2026 Performance Indicators
| Destination & Economy | 2025 Recorded Baseline | 2026 Strategic Projections | Primary Feeder Corridors | Dominant Attractions & Travel Drivers | Key Strategic & Policy Evolution |
| Arizona | • ~46.5M overnight visitors • $29.8B direct spend • $4.3B tax receipts | • ~47.2M–47.8M arrivals • ~$31.0B direct spend • High-ADR resort yield | • Domestic: CA, TX, IL, WA, NY • International: Mexico, Canada, UK, Germany | • Grand Canyon & Red Rocks of Sedona • Cactus League spring training • Sonoran desert wellness & golf resorts | Expanding dark-sky ecotourism and northern tribal cultural routes while driving off-peak summer resort pricing resilience. |
| Colorado | • 96.8M visitors (+1.4%) • $29.2B direct spend • $1.6B Rocky mountain earnings | • ~97.5M–98.2M visitors • ~$30.0B–$30.5B spend • Extended-stay shift | • Domestic: TX, CA, FL, IL, NM • International: UK, Germany, Canada, Australia | • Rocky Mountain & Mesa Verde parks • World-class ski resorts (Vail, Aspen) • Craft breweries & 43 state parks | Rebalancing day-trippers toward multi-night stays, expanding accessibility programs, and buffering snow volatility. |
| Idaho | • 35.2M visitors • $4.85B direct spend • 5.23M Boise airport transits | • ~36.0M–36.5M visitors • ~$5.1B–$5.2B spend • Rising rural share | • Domestic: WA, UT, CA, OR, MT • International: Canada, Germany, UK | • Sun Valley skiing & Sawtooth wilderness • Salmon & Snake River whitewater rafting • Boise cultural & corporate conventions | Cultivating high-yield wilderness outfitter tours, expanding direct air routes, and dispersing visitors away from urban Boise. |
| Kansas | • 38.4M arrivals • $8.2B direct spend • $13.5B economic output | • ~39.2M–39.8M arrivals • ~$8.6B–$8.8B spend • World Cup base-camps | • Domestic: MO, NE, OK, TX, CO • International: Canada, Mexico, Germany, UK | • Flint Hills & Tallgrass Prairie Preserve • Overland Park/Bluhawk youth sports complexes • Old West heritage (Dodge City) | Capitalizing on Kansas City World Cup spillover, youth sports infrastructure, and scenic dark-sky prairie byways. |
Arizona Tourism Dynamics: 2025–2026 Comparative Analysis
Arizona’s travel sector strengthened its position as a top-tier economic engine across 2025 and 2026, transitioning from sheer leisure volume into high-value experiential retreats and sports-driven hospitality. In 2025, non-resident overnight visitation approached 46.5 million arrivals, generating $29.8 billion in direct traveler spending, supporting more than 188,000 hospitality jobs, and delivering over $4.3 billion in local and state tax receipts.
Advertisement
Advertisement
Entering 2026, statewide traveler expenditures are tracking toward $31.0 billion, driven by sustained luxury Average Daily Rates (ADR) across Scottsdale, Phoenix, and Paradise Valley, alongside international route expansions into Phoenix Sky Harbor International Airport (PHX). Destination authorities have shifted attention to dispersing visitor volume outward toward lesser-visited desert state parks and northern historic towns.
Arizona 2025–2026 Inbound Feeder Distribution:
┌───────────────────────────────────────────────┐
│ • California (Drive Core):           ~32%    │
│ • Texas, Illinois, Washington, NY:   ~48%    │
│ • International (Mexico, Canada, UK): ~20%    │
└───────────────────────────────────────────────┘
Primary Visitors and Motivations:
- Feeder Corridors: Southern California represents the state’s primary domestic drive market, followed closely by winter sun-seekers from Texas, Illinois, Washington, and New York. Mexico serves as the largest international trade and shopping partner, complemented by Canadian snowbirds and long-haul outdoor enthusiasts from the United Kingdom and Germany.
- Core Travel Drivers:
- Iconic Natural Landmarks: Year-round visitation to the Grand Canyon National Park, Monument Valley Navajo Tribal Park, and the red rock canyon formations of Sedona.
- Sports Tourism & Major Winter Fixtures: Marquee events including the Cactus League Spring Training, the Waste Management Phoenix Open, and college bowl games.
- Wellness & Desert Luxury: High-end spa resorts, championship golf circuits, and designated dark-sky stargazing across the Sonoran Desert.
Colorado Tourism Dynamics: 2025–2026 Comparative Analysis
Colorado’s $29 billion tourism economy navigated a crucial transition across 2025 and 2026, pivoting away from low-margin single-day excursions toward high-yield, multi-night stays and sustainable alpine stewardship. In 2025, the Centennial State welcomed 96.8 million visitors (a 1.4% increase over 2024), generating a record $29.2 billion in direct visitor spending. The high-country “Rockies Playground”—encompassing Eagle, Summit, Pitkin, and Grand counties—alone generated $1.6 billion in hospitality earnings, balancing lower winter ski visits with record summer alpine escapes.
Advertisement
Advertisement
By 2026, visitor spending is projected to reach $30.0 to $30.5 billion across 97.5 to 98.2 million arrivals. Facing winter snow volatility and rising local operating costs, the state is prioritizing extended stays over high-volume day trips (where overnight travelers spend roughly $600 daily compared to just $107 for day-trippers) while expanding outdoor accessibility initiatives.
Colorado 2025–2026 Inbound Feeder Distribution:
┌───────────────────────────────────────────────┐
│ • Texas & California (Domestic Core): ~28%    │
│ • Midwest & Sunbelt (FL, IL, NM, KS): ~52%    │
│ • Overseas & Transatlantic:           ~20%    │
└───────────────────────────────────────────────┘
Primary Visitors and Motivations:
- Feeder Corridors: Out-of-state arrivals are led heavily by Texas and California, followed by drive-and-fly corridors from Florida, Illinois, New Mexico, and Kansas. Overseas visitors are anchored by the United Kingdom, Germany, Canada, and Australia, funneling through Denver International Airport (DEN).
- Core Travel Drivers:
- Four-Season Mountain Recreation: Premier ski and snowboard hubs (Vail, Breckenridge, Aspen, Steamboat) alongside summer alpine hiking and mountain biking.
- National & State Park Conservation: Heavy visitation to Rocky Mountain National Park, Mesa Verde’s ancestral cliff dwellings, Great Sand Dunes, and 43 designated state parks.
- Urban Culture & Gastronomy: Denver’s RiNo arts district, Red Rocks Amphitheatre concerts, craft brewery circuits, and professional sports fixtures.
Idaho Tourism Dynamics: 2025–2026 Comparative Analysis
Idaho consolidated its position as one of the fastest-growing outdoor adventure economies in the Pacific Northwest across 2025 and 2026, anchoring its tourism strategy in wilderness conservation and regional air connectivity. In 2025, Idaho registered approximately 35.2 million non-resident visitors, generating $4.85 billion in direct traveler spending, directly supporting over 38,000 hospitality jobs, and contributing $340 million in local and state tax revenue.
Advertisement
Advertisement
Moving into 2026, total direct expenditures are projected to climb to $5.1–$5.2 billion across roughly 36.5 million visits. The expansion of Boise Airport (BOI)—which surpassed 5.2 million annual passengers—has accelerated the influx of higher-spending fly-in travelers, reducing long-standing dependency on regional vehicular traffic and dispersing spending toward northern lakes and central wilderness preserves.
Idaho 2025–2026 Inbound Feeder Distribution:
┌───────────────────────────────────────────────┐
│ • Washington & Utah (Regional Drive): ~44%    │
│ • California, Oregon, & Montana:      ~38%    │
│ • International (Canada, Europe):     ~18%    │
└───────────────────────────────────────────────┘
Primary Visitors and Motivations:
- Feeder Corridors: Drive-market travelers from Washington and Utah dominate inbound volume, supplemented by significant migration and leisure flows from California, Oregon, and Montana. International travelers are led by Canadian cross-border road trips from Alberta and British Columbia, alongside European outdoor adventure groups.
- Core Travel Drivers:
- Wilderness Outfitting & Rivers: World-class whitewater rafting, kayaking, and fly-fishing on the Middle Fork of the Salmon River and the Snake River.
- Mountain Resorts & Winter Solitude: Luxury ski stays and backcountry mountaineering across Sun Valley Resort, Schweitzer, and the Sawtooth National Recreation Area.
- Scenic Byways & Ecotourism: Dark-sky stargazing across the Central Idaho Dark Sky Reserve, natural geothermal hot springs, and lakeside exploration in Coeur d’Alene.
Kansas Tourism Dynamics: 2025–2026 Comparative Analysis
Kansas significantly elevated its visitor economy across 2025 and 2026, transitioning from a transient interstate transit corridor into a high-yield sports tournament destination and authentic prairie heritage hub. In 2025, non-resident visitor volume reached 38.4 million arrivals, generating $8.2 billion in direct visitor spending, $13.5 billion in total economic output, and saving every Kansas household approximately $726 in state and local taxes.
Advertisement
Advertisement
Moving into 2026, direct spending is projected to reach $8.6 to $8.8 billion across 39.5 million visitors. This growth is heavily driven by metropolitan room compression from the Kansas City 2026 FIFA World Cup matches, the opening of major regional hospitality assets like the AdventHealth Sports Park at Bluhawk in Overland Park, and rising demand for scenic Heartland road trips.
Kansas 2025–2026 Inbound Feeder Distribution:
┌───────────────────────────────────────────────┐
│ • Missouri & Heartland Drive Basin:   ~55%    │
│ • Nebraska, Oklahoma, Texas, Colorado: ~32%   │
│ • Transatlantic & Canadian Inbound:   ~13%    │
└───────────────────────────────────────────────┘
Primary Visitors and Motivations:
- Feeder Corridors: Interstate drive markets generate over 75% of non-local arrivals, dominated by Missouri (anchored by the shared Kansas City metropolitan corridor), Nebraska, Oklahoma, Texas, and Colorado. Long-haul and international travelers originate from Canada, Mexico, Germany, and the United Kingdom via Kansas City International Airport (MCI).
- Core Travel Drivers:
- Tallgrass Prairie Ecotourism: Unspoiled open-range exploration in the Flint Hills, scenic prairie byways, and the Tallgrass Prairie National Preserve.
- Youth Sports Megacomplexes: Nationwide competitive soccer, baseball, and basketball tournaments staged at state-of-the-art facilities in Overland Park, Olathe, and Wichita.
- Old West & Aviation Heritage: Historic cattle frontier settlements in Dodge City and Abilene, complemented by premier aerospace exhibits at the Cosmosphere and Exploration Place.
Why Is Colorado Outperforming Arizona, Idaho and Kansas in Visitor Arrivals?
Colorado stands out as the leading destination among these four US states in terms of visitor volume. According to the supplied tourism analysis, Colorado welcomed approximately 96.8 million visitors in 2025, compared with 46.5 million overnight visitors in Arizona, 38.4 million arrivals in Kansas and 35.2 million visitors in Idaho. However, these figures should not be treated as a fully standardised ranking because Arizona’s total specifically refers to overnight visitors, while the other states use different visitor-count definitions.
Colorado’s competitive strength comes from its diverse, year-round tourism attractions. Rocky Mountain National Park, Aspen, Vail and Breckenridge attract visitors seeking skiing, hiking, mountain adventures and outdoor recreation. Denver also contributes through cultural attractions, sporting events and business travel.
Interestingly, Arizona’s reported direct visitor spending of $29.8 billion exceeded Colorado’s $29.2 billion despite its lower reported visitor count. This contrast highlights an important tourism trend: higher visitor numbers do not automatically translate into higher tourism expenditure.
Advertisement
Advertisement
For travellers, the comparison demonstrates how Colorado’s mountain tourism, Arizona’s luxury desert experiences, Idaho’s wilderness adventures and Kansas’s prairie heritage offer distinctly different American holidays.
How Are International Travellers From the UK, Germany, Canada and Mexico Influencing America’s Tourism Growth?
International tourism represents another important dimension of the changing visitor economy across Colorado, Arizona, Idaho and Kansas. The supplied analysis identifies the United Kingdom, Germany, Canada and Mexico as significant international source markets for these destinations, although their relative contributions differ.
Colorado attracts international visitors through Denver International Airport, with its Rocky Mountain landscapes, ski resorts and national parks appealing to travellers from the UK, Germany, Canada and Australia. Arizona benefits from its proximity to Mexico, alongside Canadian winter visitors and European travellers exploring the Grand Canyon, Sedona and Sonoran Desert.
Idaho appeals to Canadian road-trippers and European outdoor enthusiasts interested in whitewater rafting, wilderness exploration and mountain resorts. Kansas offers a contrasting experience through historic towns, sports tourism and the Flint Hills.
These differences create opportunities for international travellers to combine several states within a single American itinerary, connecting iconic landmarks with lesser-known destinations.
The wider tourism significance lies in geographic diversification. Encouraging visitors to explore beyond established hotspots could help distribute tourism expenditure across smaller communities, support regional businesses and strengthen year-round travel demand.
Advertisement
