
Dallas-Fort Worth Airport Tops Most Stressful US Airports as Delays Put Travellers Under Pressure

Published
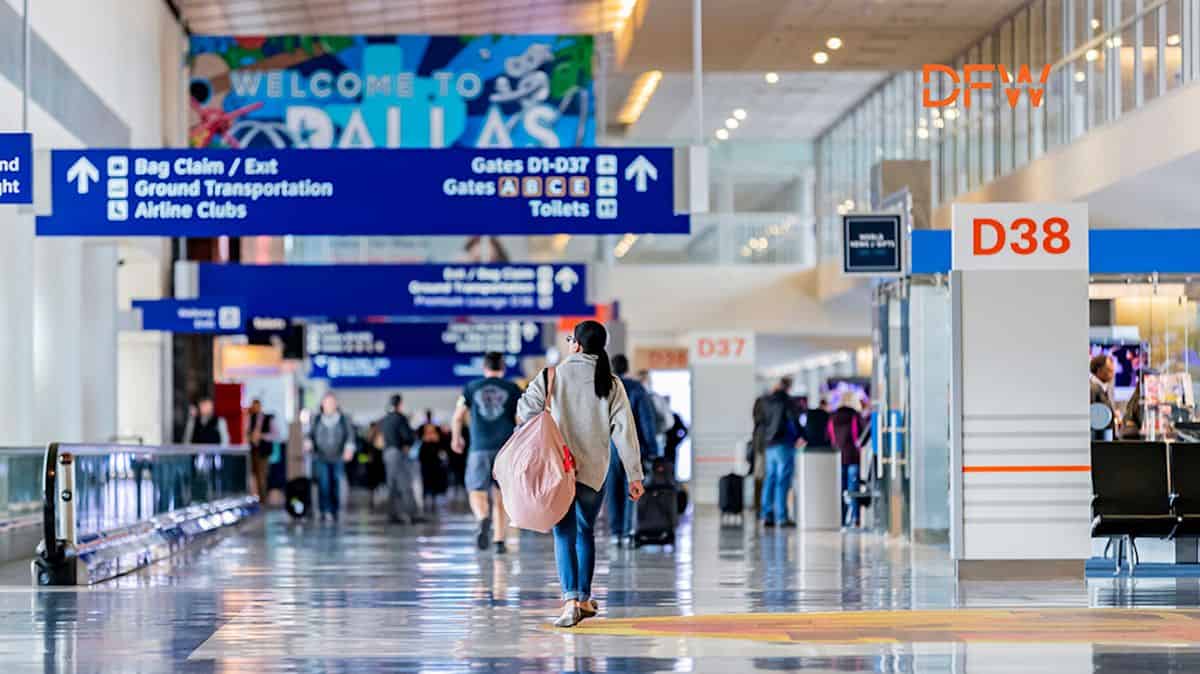
Dallas-Fort Worth International Airport (DFW) has emerged as the most stressful major airport in a new US ranking. The analysis examined 55 busy airports using delay rates, cancellations, worsening delays and ground access.
Chicago O’Hare International Airport ranked second, while Ronald Reagan Washington National Airport placed third. The findings highlight how airport size alone does not determine traveller stress. Instead, several pressures can combine to make a journey more difficult.
DFW recorded a 27.86% delay rate in the study, the highest among the airports examined. Its delays had also increased 33.67% from the 2021 baseline, while the airport sits about 22 miles from downtown Dallas.
The ranking comes from Rightway Parking, which assessed operational and accessibility factors using federal aviation data and Google Maps measurements. It is not an official US government airport ranking, but it provides a useful travel-planning perspective.
Advertisement
Advertisement
The result is particularly notable because DFW remains one of America’s most important aviation gateways. The airport handled more than 86 million passengers in fiscal 2025, according to its own latest figures.
What Makes An Airport Stressful
Airport stress rarely comes from one problem. A delayed flight can be frustrating, but the pressure increases when passengers also face long ground journeys or uncertain connections.
Advertisement
Advertisement
Rightway’s analysis combines five factors into a single stress score. These include flight delay rates, cancellation rates, changes in delays since 2021, driving distance and driving time from the relevant city centre.
That approach differs from conventional airport rankings. Most airport performance comparisons focus on punctuality, passenger satisfaction or infrastructure.
This study instead examines the complete journey towards and through an airport. That makes it particularly relevant for travellers who must reach a terminal at a fixed time.
DFW demonstrates why that broader measurement matters. Its 27.86% delay rate gives it the highest delay figure in the study, according to Rightway’s analysis.
The airport also recorded a 2.76% cancellation rate. That placed DFW among the airports with the highest cancellation levels in the study.
Its location adds another consideration. Rightway estimates that DFW is approximately 22 miles from downtown, meaning passengers must allow significant time for the surface journey.
Advertisement
Advertisement
That does not make DFW an inconvenient airport in every circumstance. Its extensive road network, public transport connections and enormous route network can make it highly practical for many travellers.
However, the ranking shows that airport convenience has several dimensions. A well-connected airport can still create pressure when disruption and journey distance combine.
America’s Ten Highest-Stress Airports
The ranking places several of America’s largest aviation hubs among the most stressful airports. Their inclusion reflects the operational complexity of handling enormous passenger and aircraft volumes.
| Rank | Airport | State | Main Pressure |
|---|---|---|---|
| 1 | Dallas-Fort Worth International Airport | Texas | High delays and significant ground distance |
| 2 | Chicago O’Hare International Airport | Illinois | Rising delays and long city access |
| 3 | Ronald Reagan Washington National Airport | Virginia | High cancellations and worsening delays |
| 4 | John F. Kennedy International Airport | New York | Major-hub complexity and access |
| 5 | Philadelphia International Airport | Pennsylvania | Overall disruption pressure |
| 6 | LaGuardia Airport | New York | High cancellation rate |
| 7 | Denver International Airport | Colorado | High delay rate |
| 8 | Detroit Metropolitan Wayne County Airport | Michigan | Major-hub disruption |
| 9 | Washington Dulles International Airport | Virginia | Long distance from central Washington |
| 10 | Charlotte Douglas International Airport | North Carolina | Significant deterioration in delays |
The concentration of major hubs near the top is one of the study’s most striking findings. These airports serve huge passenger populations and support extensive domestic and international networks.
However, their scale can also create complexity. A disruption affecting one aircraft can potentially affect subsequent flights, gates, crews and connecting passengers.
That network effect makes major hubs particularly sensitive to delays. It also explains why passengers with tight connections face greater risks at large connecting airports.
Advertisement
Advertisement
DFW Carries A Heavy Passenger Load
DFW’s ranking needs to be viewed against its extraordinary operating scale. The airport’s latest figures show that it welcomed more than 86 million passengers during fiscal 2025.
The airport expects demand to continue increasing. DFW says it is preparing for potentially 100 million annual passengers by the end of the decade.
That growth has significant implications for infrastructure. The airport is pursuing a major capital programme focused on capacity, terminals and the passenger experience.
DFW’s scale also explains why a high ranking for travel stress does not automatically indicate poor airport management. Large airports face a fundamentally different operational challenge from smaller regional gateways.
DFW’s history demonstrates that transformation clearly. The airport opened in 1974 and has since developed into a major global aviation hub serving the Dallas-Fort Worth metropolitan area.
Its importance extends beyond Texas. DFW provides extensive connectivity across the United States and acts as a major international gateway.
Advertisement
Advertisement
That role means travellers often have limited alternatives when their itinerary depends on DFW. The airport can be the most logical connection point even when passengers would prefer a less complicated gateway.
Chicago Shows Another Kind Of Pressure
Chicago O’Hare provides a different example of airport stress. Its delay rate stood at 24.68%, below DFW’s figure.
However, the study found that O’Hare’s delays had increased 42.77% since 2021. That deterioration gives the airport a significant position in the overall ranking.
Ground access adds another layer. Rightway estimates that reaching O’Hare from downtown Chicago can take around 50 minutes.
This matters particularly for travellers with early-morning or evening flights. Traffic conditions can turn a routine journey into a much longer trip.
The lesson is broader than Chicago. Travellers should consider both airport reliability and airport accessibility when evaluating an itinerary.
Advertisement
Advertisement
A flight leaving at 8am does not necessarily mean a traveller can leave the city at 6am. Security, traffic and terminal walking distances can require substantially more time.
Reagan Highlights Cancellation Risk
Ronald Reagan Washington National Airport occupies third place, but its main weakness differs from DFW and O’Hare.
The airport recorded a 3.86% cancellation rate, the highest among the 55 airports in the study. Its delays had also increased 73.92% since 2021.
That makes Reagan an important example of why cancellation risk deserves separate attention.
A delay may still allow passengers to complete their journey later. A cancellation can require a new flight, a longer wait or an overnight stay.
For business travellers, the consequences can be particularly significant. Missing a meeting because of an extended delay can create costs that never appear in an airport’s passenger statistics.
Advertisement
Advertisement
The same applies to leisure travellers. A cancelled flight can disrupt hotel check-in, cruise departures, rail connections and pre-booked attractions.
Smaller Airports Tell A Different Story
At the other end of the ranking, Salt Lake City International Airport emerged as the least stressful airport in the analysis.
San Jose Mineta International Airport ranked second, while Daniel K. Inouye International Airport in Honolulu placed third.
These airports generally combine lower disruption levels with relatively convenient access. Their position demonstrates why airport size is not necessarily synonymous with passenger inconvenience.
| Rank | Airport | State | Notable Advantage |
|---|---|---|---|
| 1 | Salt Lake City International Airport | Utah | Lower disruption and convenient access |
| 2 | San Jose Mineta International Airport | California | Lower disruption and city proximity |
| 3 | Daniel K. Inouye International Airport | Hawaii | Low cancellation exposure |
| 4 | Albuquerque International Sunport | New Mexico | Convenient access |
| 5 | Reno-Tahoe International Airport | Nevada | Smaller gateway profile |
| 6 | Phoenix Sky Harbor International Airport | Arizona | Strong city accessibility |
| 7 | Ted Stevens Anchorage International Airport | Alaska | Lower overall stress score |
| 8 | Sacramento International Airport | California | Lower disruption profile |
| 9 | Oakland San Francisco Bay Airport | California | Alternative Bay Area gateway |
| 10 | Eppley Airfield | Nebraska | Convenient access to Omaha |
The difference between these airports and major hubs is not simply passenger volume. The ranking suggests that shorter ground journeys and lower disruption exposure can materially improve the travel experience.
That can influence airport choice in metropolitan areas with multiple gateways.
Advertisement
Advertisement
Why Airport Choice Matters More
Travellers often select flights based on price, schedule and airline. Airport accessibility can receive less attention, particularly when booking several months ahead.
Yet the airport itself can influence the total journey considerably. A cheaper ticket may require a long road transfer, an awkward connection or additional buffer time.
The reverse can also happen. A slightly more expensive flight from a convenient airport may reduce the risk of missing an onward connection.
This calculation becomes increasingly important for international travellers. A delayed domestic sector can affect immigration timing, long-haul departures and pre-booked accommodation.
Travellers should therefore examine the entire itinerary rather than only the airfare.
That means considering departure time, airport location, connection length, alternative gateways and historical disruption.
Advertisement
Advertisement
Federal Data Adds Wider Context
The underlying delay and cancellation information comes from federal aviation data. The US Department of Transportation publishes monthly Air Travel Consumer Reports using information collected by the Bureau of Transportation Statistics.
The reports cover flight delays and several other passenger-related measures. The latest 2026 reporting series includes data through July 2026.
The federal reports provide an important benchmark because they allow travellers and researchers to examine airline and airport performance through a consistent reporting framework.
However, the Rightway study goes beyond those operational figures. It adds airport accessibility and longer-term changes in delays to produce its overall stress assessment.
That distinction is important when interpreting the ranking. A stressful airport is not necessarily an unsafe airport or a poorly managed airport.
Instead, the term describes the likelihood that several travel-friction factors may affect a passenger’s journey.
Advertisement
Advertisement
What Travellers Can Do Differently
The ranking offers practical lessons for passengers flying through major American hubs.
Travellers using DFW, O’Hare, Reagan or other high-ranking airports should build additional time into their itineraries. This is particularly important when connecting between domestic and international flights.
A longer connection can reduce the consequences of a modest delay. It also gives passengers more flexibility when gates change or terminals become congested.
Passengers should also check their flight status before leaving for the airport. Airline applications and text alerts can provide earlier warnings about operational changes.
Ground transportation deserves equal attention. Travellers should investigate the expected journey from their accommodation to the airport rather than relying solely on the scheduled flight time.
The most useful strategy is to protect the parts of the journey that passengers can control. Travellers cannot prevent weather disruptions or aircraft delays, but they can choose sensible connection times.
Advertisement
Advertisement
A Better Way To Read Airport Rankings
Airport rankings can be useful, but they should never become a simple list of airports to avoid.
The busiest gateways frequently appear in stress rankings because they handle enormous passenger volumes. They also provide the most extensive route networks, making them essential to millions of journeys.
DFW is a clear example. Its ranking as the most stressful airport exists alongside its position as one of the world’s most important aviation hubs.
The airport continues to invest heavily in capacity and infrastructure. Its long-term passenger projections also indicate that demand will remain substantial.
For travellers, the most useful interpretation is therefore not “avoid DFW”. It is “allow more time when using DFW”.
The same logic applies to O’Hare, Reagan National, JFK, Denver and other high-ranking gateways.
Advertisement
Advertisement
The Travel Friction Behind The Numbers
The new ranking provides an unusual way to understand modern air travel. It moves beyond the traditional question of whether an airport is large, attractive or well equipped.
Instead, it asks how much friction passengers encounter across the journey. Delays, cancellations, worsening reliability and ground access can collectively shape the travel experience.
DFW’s first-place position reflects that combination. Its high delay rate sits alongside a substantial distance from central Dallas and a major cancellation exposure.
Meanwhile, Salt Lake City demonstrates the advantages of lower disruption and convenient accessibility.
The contrast offers a valuable lesson for travellers planning future trips across the United States. The best airport is not always the biggest airport or the cheapest airport.
For passengers, the smartest choice may be the gateway that offers the strongest balance between price, schedule, reliability and access.
For airlines and airports, the findings highlight the growing importance of punctuality and surface connectivity. As passenger volumes continue to rise, reducing travel friction will become an increasingly important part of the airport experience.
Advertisement
