
California Goes Head-to-Head With Georgia in 2026 Tourism Surge as Global Events Reshape American Travel

Updated
Published
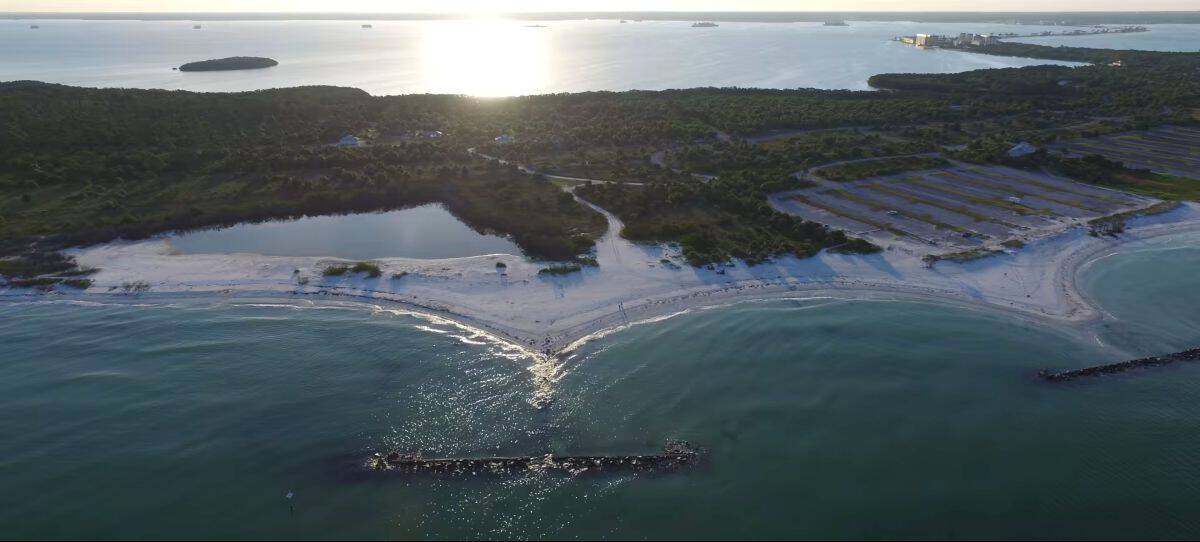
California Goes Head-to-Head With Georgia in 2026 Tourism Surge as Global Events Reshape American Travel. California leads with its enormous visitor economy, high-value international demand and global event preparations, while Georgia is strengthening its position through Atlanta’s convention sector, major sporting events and expanding visitor spending.Travellers from Canada, the United Kingdom, Mexico and Germany are helping strengthen international demand across these US tourism markets.
Georgia Tourism Dynamics: 2025–2026 Comparative Economic Analysis
Georgia’s tourism economy achieved historic milestones in 2025 before accelerating toward international mega-event expansion in 2026. Official state metrics confirm Georgia welcomed a record 175.6 million visitors in 2025, generating $46.2 billion in direct visitor spending, $84.1 billion in total statewide economic impact, and sustaining over 473,800 jobs. Projections for 2026 track direct expenditures past $48.5 billion, catalyzed by Atlanta’s high-yield corporate convention pipeline, film tourism, and stadium preparations for the 2026 FIFA World Cup matches.
Advertisement
Advertisement
| Indicator / Metric | 2025 Recorded Benchmark | 2026 Projections & Trends |
| Total Inbound Visitors | 175.6 million (All-time high) | ~178.5–180.0 million |
| Direct Traveler Spending | $46.2 billion | ~$48.5–49.0 billion |
| Total Economic Impact | $84.1 billion | ~$88.0 billion |
| Direct Tourism Employment | 473,837 jobs | ~480,000+ jobs |
| State & Local Tax Revenue | ~$5.2 billion | ~$5.5 billion |
Statewide visitation metrics and economic benchmarks are referenced via official research reports from Explore Georgia (Georgia Department of Economic Development) and official releases from the Office of Governor Brian P. Kemp.
Inbound Markets: Who Visits Most and Why?
- Primary Domestic Feeder Markets: Domestic travelers make up over 90% of total volume, anchored by neighboring southeastern drive corridors—primarily Florida, North Carolina, Tennessee, Alabama, and South Carolina—alongside major flight corridors from New York and Texas.
- Leading International Corridors: Canada, the United Kingdom, Germany, and Mexico lead overseas arrivals, with growing long-haul traffic channeled through Hartsfield-Jackson Atlanta International Airport (ATL).
- Core Travel Drivers:
- Metropolitan Hubs & Mega Conventions: Metro Atlanta anchors massive convention attendance at the Georgia World Congress Center, alongside marquee cultural draws like the Georgia Aquarium and World of Coca-Cola.
- Historic Coastal & Heritage Corridors: Savannah and the Golden Isles (Jekyll Island, St. Simons) draw millions for historic district preservation, luxury coastal resorts, and culinary travel.
- Outdoor Recreation & Mountain Escapes: The Blue Ridge Mountains and North Georgia wine corridors attract regional road-trippers and seasonal outdoor enthusiasts escaping urban density.
California Tourism Dynamics: 2025–2026 Comparative Economic Analysis
California’s travel sector maintains its position as the nation’s largest tourism economy, transitioning across 2025 and 2026 from volume recovery to high-yield experiential spending and global mega-event staging. In 2025, statewide visitor spending reached a record $158.9 billion, supporting 1.2 million jobs and generating $13.6 billion in local and state tax receipts. Projections for 2026 track spending past $163 billion, driven by international corridor stabilization, corporate business travel, and early infrastructure momentum leading into the 2026 FIFA World Cup matches and upcoming Olympic preparation.
Advertisement
Advertisement
| Metric / Indicator | 2025 Recorded Data | 2026 Projections & Trends |
| Total Visitor Volume | ~279 million | ~285 million |
| Direct Traveler Spending | $158.9 billion | ~$163.5 billion |
| Travel-Generated Tax Revenue | $13.6 billion | ~$14.1 billion |
| Direct Tourism Employment | ~1.20 million jobs | ~1.21 million jobs |
| International Traveler Share | ~16.4 million visitors | ~17.2 million visitors |
Statutory Attribution: Economic metrics and visitor breakdowns are benchmarked against official releases from Visit California
and economic impact data published by the Office of Governor Gavin Newsom (GOV.CA.GOV).
As per Anup Keshan, Editor in Chief of Travel And Tour World, “California is moving beyond visitor volume towards higher-value travel, where global events, international markets and experience-led tourism can generate stronger economic returns. With visitor spending projected to move beyond $163 billion in 2026, the state’s next tourism chapter will increasingly depend on converting its global visibility into longer stays and wider regional spending.”
Advertisement
Advertisement
Inbound Feeder Markets: Who Visits Most and Why?
- Primary Inbound Travelers: Domestic travelers form the overwhelming majority (over 80%), led by intra-state residents and drive/short-haul flight corridors from Arizona, Nevada, Washington, Oregon, and Texas. Internationally, Mexico and Canada dominate land and air border arrivals, while overseas traffic is anchored by the United Kingdom, China, Japan, Australia, and rapidly expanding visitor arrivals from India.
- Core Travel Drivers:
- Iconic Attractions & Coastal Corridors: High demand for Southern California theme parks, scenic coastal routes like Highway 1, and premier national parks (Yosemite, Joshua Tree, Death Valley).
- Global Entertainment & Cultural Metros: Los Angeles and the San Francisco Bay Area draw domestic and overseas vacationers seeking cultural landmarks, world-class culinary scenes, and major sports fixtures.
- Conventions & Business Travel: Urban convention centers in San Diego, Anaheim, and San Francisco capture high-ADR business travelers and international trade delegates.
Florida Tourism Dynamics: 2025–2026 Comparative Economic Analysis
Florida’s tourism ecosystem navigated record volume in 2025 before settling into a mature, value-focused plateau in 2026. Official statutory estimates indicate Florida welcomed an all-time record 143.3 million visitors in 2025, generating over $135 billion in direct out-of-state visitor spending and supporting 1.8 million jobs. In 2026, statewide visitation slightly normalized—tracking roughly 1% to 1.4% lower through the first half—amid foreign exchange pressure on Canadian “snowbird” travel, even as high-spending overseas arrivals expanded and Central Florida set local economic records.
| Indicator / Metric | 2025 Recorded Benchmark | 2026 Mid-Year & Annual Trends |
| Total Inbound Visitors | 143.3 million (Record high) | ~141.5–142.0 million (Slight softening) |
| Domestic Traveler Share | ~130.9 million (91.3%) | ~129.5 million (~91.5%) |
| Canadian Cross-Border Arrivals | 3.17 million | ~2.73 million (Down ~13.9% H1 2026) |
| Overseas International Volume | 9.3 million | ~9.5 million (+2.2% growth trajectory) |
| Central Florida Tourism Impact | $98.6 billion | Tracking ~$100+ billion (Meetings/Parks) |
Statutory Attribution: Statewide visitation metrics and economic benchmarks are referenced via official research reports from VISIT FLORIDA and regional impact audits published by Visit Orlando.
Inbound Markets: Who Visits Most and Why?
- Primary Domestic Feeder Markets: Domestic travelers generate over 90% of total arrivals, led by East Coast and Midwestern drive-and-fly corridors—primarily New York, Georgia, Ohio, Pennsylvania, North Carolina, and Illinois.
- Leading International Corridors: Canada remains the top overall international source market (~3.2 million), followed by Brazil (1.3 million), the United Kingdom (1.2 million), Colombia (655,000), and Mexico (613,000).
- Core Travel Drivers:
- Global Theme Parks & Family Entertainment: Orlando welcomed a record 76.7 million visitors, anchored by Walt Disney World, Universal Orlando Resort, and major corporate convention business.
- Beaches & Cruise Departures: PortMiami, Port Everglades, and Port Canaveral generate millions of multi-night lodging stays linked to cruise departures, alongside year-round leisure beach corridors across the Gulf Coast and South Florida.
- Winter Sun & Convention Tourism: Escaping freezing northern winter climates remains the primary seasonal driver for retirees, remote workers, and major Q4 commercial summits.
Alaska Tourism Dynamics: 2025–2026 Comparative Analysis
Alaska’s tourism sector across 2025 and 2026 reflects a strategic transition from record-breaking cruise capacity toward high-yield land dispersal and four-season visitor spending. Following historic cruise volumes that exceeded 1.65 million passengers in 2024, the 2025–2026 cycle emphasizes destination management, capping peak port congestion in hubs like Juneau while accelerating off-peak winter tourism and independent travel.
Comparative Shift: 2025 vs. 2026
- 2025 Performance: Alaska sustained over 2.7 million total non-resident visitors, generating roughly $5.7 billion in economic impact. High-volume marine traffic represented about 60% of all arrivals, though independent land-and-air vacationers generated the highest per-capita spending.
- 2026 Projections & Trends: Total visitation stabilized near 2.75 million arrivals as maritime caps limited dockings. State initiatives expanded shoulder-season travel, with winter northern lights tourism, dog sledding, and aurora rail tours across Fairbanks and Anchorage capturing over 20% of annual visitor arrivals.
| Indicator / Metric | 2025 Baseline | 2026 Projections & Shifts |
| Total Non-Resident Visitors | ~2.70 million | ~2.75 million |
| Direct Traveler Spending | ~$3.9 billion | ~$4.1 billion |
| Cruise Passenger Share | ~1.65 million (61%) | ~1.67 million (60% — Port caps active) |
| Average Party Spend (Anchorage/Interior) | $2,240 | ~$2,350+ |
| Winter / Shoulder-Season Share | ~19% | ~21% (Aurora & winter sports growth) |
Statistical indicators and traveler profiles are benchmarked against official data releases from the Alaska Travel Industry Association (ATIA) and statutory research published by Visit Anchorage.
Inbound Markets: Who Visits Most and Why?
- Primary Feeder Markets: Domestic travelers account for over 83% of leisure arrivals, dominated by West Coast and Sunbelt states (California, Washington, Texas, and Florida). International travelers represent 17%, led by Canada, Australia, the United Kingdom, and Germany.
- Traveler Demographics: The typical traveler averages 48–49 years of age with an average household income exceeding $150,000, skewing increasingly toward younger multi-generational families and affluent active adventurers.
- Core Travel Drivers:
- Pristine Wilderness & Glaciers: Demand to view calving tidewater glaciers (Glacier Bay, Kenai Fjords) and national parks like Denali.
- Wildlife Expeditions: Viewing grizzly bears, bald eagles, and marine mammals (orcas, humpback whales) in unconfined habitats.
- Indigenous Culture & Aurora Borealis: Expanding winter tourism driven by dark-sky viewing and Native heritage cultural programs.
U.S. State Tourism Evolution: Chronological Statehood Comparison (2025–2026)
| State (Statehood Order) | 2025 Baseline Record | 2026 Forecast / Trajectory | Primary Feeder Corridors | Core Travel Drivers & Attractions | Strategic Policy & Economic Shift |
| Georgia (4th State — Jan 2, 1788) | • 175.6M total visitors • $46.2B direct spend • $84.1B total output | • ~178.5M–180.0M visitors • ~$48.5B–$49.0B direct spend • ~480,000+ industry jobs | • Domestic (>90%): FL, NC, TN, AL, SC, NY, TX • International: Canada, UK, Germany, Mexico | • Metro Atlanta & GWCC conventions • Savannah & Golden Isles heritage • Blue Ridge mountain retreats | Capitalizing on urban mega-events and stadium upgrades for the 2026 FIFA World Cup alongside growing international transit via ATL. |
| California (31st State — Sept 9, 1850) | • ~279M total visitors • $158.9B direct spend • $13.6B state/local tax | • ~285M total visitors • ~$163.5B direct spend • ~17.2M international arrivals | • Domestic (>80%): In-state, AZ, NV, WA, OR, TX • International: Mexico, Canada, UK, China, India | • Theme parks & Highway 1 coastlines • Iconic parks (Yosemite, Joshua Tree) • Tier-1 conventions (SD, SF, Anaheim) | Transitioning from pure volume recovery to high-yield international spending and global sports staging (World Cup and Olympic prep). |
| Florida (27th State — Mar 3, 1845) | • 143.3M total visitors • >$135B direct spend • 1.8M supported jobs | • ~141.5M–142.0M visitors • Normalized leisure pace • High-yield overseas growth (+2.2%) | • Domestic (91.3%): NY, GA, OH, PA, NC, IL • International: Canada (softening), Brazil, UK, Colombia | • Orlando theme parks & conventions • South Florida beaches & cruise hubs • Winter sun & remote-work stays | Balancing softer Canadian cross-border drive volume with record Central Florida commercial summits and high-ADR international corridors. |
| Alaska (49th State — Jan 3, 1959) | • ~2.70M non-resident visitors • ~$3.9B direct spend • 1.65M cruise passengers | • ~2.75M total arrivals • ~$4.1B direct spend • 21% winter/shoulder share | • Domestic (>83%): CA, WA, TX, FL • International (17%): Canada, Australia, UK, Germany | • Tidewater glaciers & Denali National Park • Unconfined wildlife expeditions • Aurora borealis & Indigenous heritage | Managing peak port congestion through municipal cruise caps in Southeast hubs while expanding year-round Interior rail and winter aurora tourism. |
Key Analytical Takeaways Across Destinations
- Volume Stabilization vs. High-Yield Spend: Across all four corridors, destination management organizations are prioritizing revenue density over raw foot-traffic records. California and Florida continue to anchor the nation’s largest absolute visitor economies, while Georgia and Alaska emphasize infrastructure dispersal to maximize regional economic retention.
- Event & Seasonality Hedging: While Florida and California leverage mega-convention infrastructure and upcoming international sports tournaments to mitigate domestic leisure softening, Alaska and Georgia are actively cultivating off-peak shoulder travel (e.g., Arctic aurora seasons and North Georgia mountain/film corridors) to sustain year-round hospitality employment.
California and Georgia are emerging as two distinct forces in American tourism in 2026. California’s enormous visitor economy, international reach and global events provide significant scale, while Georgia’s convention business, Atlanta gateway and major sporting events support further growth. Demand involving markets including Canada, the United Kingdom, Mexico and Germany adds an international dimension, showing how visitor spending, connectivity and event-led travel are transforming tourism across both states.
Advertisement
