
Nevada Ignites Explosive Tourism Showdown as Kansas Massachusetts and Oklahoma Chase Stunning 2026 Gains

Published
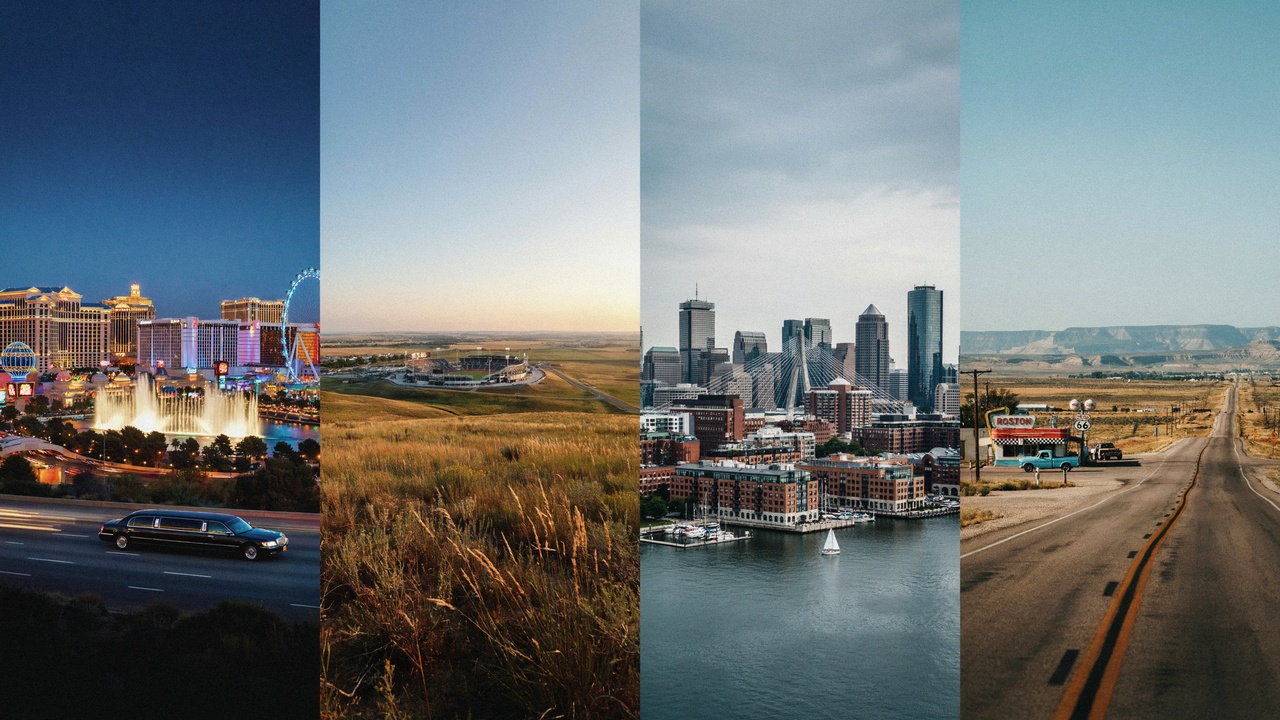
Nevada Ignites Explosive Tourism Showdown as Kansas Massachusetts and Oklahoma Chase Stunning 2026 Gains. Based on the supplied estimates, Nevada could attract 40.5 million visitors, while Kansas may reach 39.8 million. Massachusetts is projected to generate up to $27.5 billion in visitor spending, and Oklahoma could approach $13.5 billion. Major sporting events, the FIFA World Cup, Route 66 centenary celebrations, business conventions and outdoor tourism are reshaping travel demand. Together, these four states highlight how American tourism is shifting towards higher visitor spending, major events and diverse travel experiences.
Nevada Tourism Dynamics: 2025–2026 Comparative Economic Analysis
Nevada’s visitor economy recalibrated across 2025 and 2026, transitioning from high-volume leisure recovery toward high-yield corporate conventions and sports entertainment. In 2025, Las Vegas recorded 38.5 million visitors, yet statewide gaming revenue hit an all-time record of $15.8 billion, demonstrating higher per-capita spending.
Advertisement
Advertisement
Entering 2026, visitation stabilized around 40.5 million travelers, supported by expanding trade show calendars, ticketed sports events, and rural eco-destinations like Lake Tahoe and Great Basin National Park.This data is covered from the Las Vegas Convention and Visitors Authority (LVCVA) and the Nevada Gaming Control Board (NGCB).
| Indicator / Metric | 2025 Recorded Benchmark | 2026 Projections & Trends |
| Las Vegas Visitor Volume | 38.5 million | ~40.5 million |
| Nevada Statewide Gaming Revenue | $15.8 billion (Record) | ~$16.0 billion |
| Las Vegas Strip Hotel Occupancy | 80.3% | ~82.5% |
| Convention & Trade Show Attendees | 6.0 million | ~6.4–6.6 million |
| Average Daily Room Rate (ADR) | $183.52 (Strip: ~$199.79) | ~$188.00 |
Inbound Feeder Markets and Travel Drivers
- Who Visits Most: Southern California forms the largest domestic feeder market, generating nearly 30% of Las Vegas arrivals via Interstate 15, followed by Arizona, Utah, Texas, and Washington. Mexico, Canada, and the UK lead international volume.
- Why They Come:
- Integrated Resorts & Nightlife: Strip casino gaming, Michelin-starred dining, and residencies.
- Global MICE Industry: Mega-expos like CES, CONEXPO, and SEMA.
- Sports Tourism & Outdoor Recreation: Events at Allegiant Stadium and Formula 1, paired with Lake Tahoe skiing and desert exploration.
Kansas Tourism Dynamics: 2025–2026 Comparative Economic Analysis
Kansas expanded its visitor economy across 2025 and 2026, pivoting from highway drive-through travel toward high-yield sports tourism, prairie ecotourism, and cultural heritage corridors. In 2025, statewide visitor volume reached approximately 38.4 million arrivals, generating $8.2 billion in direct traveler spending, $13.5 billion in total economic output, and $843 million in state and local tax receipts.
Advertisement
Advertisement
Moving into 2026, direct spending is projected to approach $8.6–$8.8 billion, catalyzed by metropolitan spillover and base-camp accommodations from the Kansas City 2026 FIFA World Cup matches, youth tournament traffic at mega-sports venues like Bluhawk, and rising scenic byway tourism.
| Indicator / Metric | 2025 Recorded Benchmark | 2026 Projections & Trends |
| Total Inbound Visitors | ~38.4 million | ~39.2–39.8 million |
| Direct Traveler Spending | $8.2 billion | ~$8.6–$8.8 billion |
| Total Economic Impact | $13.5 billion | ~$14.0–$14.2 billion |
| State & Local Tax Revenue | $843 million | ~$875–$890 million |
| Household Tax Savings Offset | $726 per household | ~$745–$760 per household |
Inbound Feeder Markets and Travel Motivations
- Who Visits Most: Regional drive corridors deliver over 75% of non-local arrivals, led by Missouri (anchored by the greater Kansas City metropolitan basin), Nebraska, Oklahoma, Texas, and Colorado. International travel is led by Canada, Mexico, Germany, and the United Kingdom, bolstered by aviation access through Kansas City International Airport (MCI).
- Why They Come:
- Tallgrass Prairie & Ecotourism: Unspoiled landscapes across the Flint Hills, the Tallgrass Prairie National Preserve, and certified dark-sky outdoor recreation.
- Youth Sports & Major Tournaments: State-of-the-art sports facilities across Overland Park, Olathe, and Wichita hosting national travel-team showcases.
- Old West History & Space Heritage: Historic cattle trail heritage in Dodge City and Abilene, paired with aerospace history at the Cosmosphere and Exploration Place.
Massachusetts Tourism Dynamics: 2025–2026 Comparative Economic Analysis
Massachusetts experienced significant visitor economy expansion across 2025 and 2026, transitioning from steady domestic volume into high-yield international and event-driven growth. In 2025, statewide direct visitor spending reached $25.8 billion across roughly 29.5 million person-trips, supporting over 150,000 jobs.
Advertisement
Advertisement
Greater Boston anchored this performance, logging 38.7 million domestic visits ($14.08 billion spend) and 2.2 million international arrivals. Entering 2026, total direct expenditures climbed toward $27.2 billion, catalyzed by Boston’s hosting of 2026 FIFA World Cup matches, summer hotel occupancy reaching 89.7%, and expanding transatlantic routes into Boston Logan International Airport.
| Metric / Indicator | 2025 Recorded Benchmark | 2026 Projections & Trends |
| Total Person-Trips (Statewide) | ~29.5 million | ~30.8–31.2 million |
| Direct Visitor Spending | ~$25.8 billion | ~$27.2–$27.5 billion |
| Boston Domestic Visitor Spend | $14.08 billion (38.7M visitors) | ~$14.90 billion |
| Peak Hotel Occupancy (Boston) | 87.8% (October peak) | 89.7% (World Cup / July peak) |
| Primary International Drivers | Canada, UK, China, India | Canada (+10.2% air), UK, Americas |
Primary Feeder Markets and Travel Motivations
- Who Visits Most: Domestic drive markets from New York, Connecticut, Rhode Island, and New Hampshire generate over 70% of total volume. Internationally, Canada leads total arrivals, followed by the United Kingdom, China, India, and Germany.
- Why They Come:
- Revolutionary & Living Heritage: High year-round demand for Boston’s Freedom Trail, Plymouth, and Salem’s cultural history.
- Higher Education & Coastal Escapes: Ivy League campus visits and medical hubs, paired with summer escapes across Cape Cod, Martha’s Vineyard, Nantucket, and the Berkshires.
- Global Sports & MICE Events: Major conventions at the Boston Convention and Exhibition Center (BCEC) and marquee sporting fixtures.
Oklahoma Tourism Dynamics: 2025–2026 Comparative Economic Analysis
Oklahoma’s visitor economy accelerated across 2025 and 2026, transitioning from regional drive-market leisure into high-yield heritage tourism and nationwide road-trip expansion. In 2025, statewide direct traveler spending reached a benchmark $12.8 billion across 25.2 million visitors, generating $955 million in state and local tax revenue and sustaining roughly 109,300 jobs. Moving into 2026, direct spending is projected to approach $13.3–$13.5 billion, propelled by statewide celebrations for the historic Route 66 Centennial (1926–2026), expanded tribal resort hospitality, and rising hotel occupancy across Oklahoma City and Tulsa.
Advertisement
Advertisement
| Metric / Indicator | 2025 Recorded Benchmark | 2026 Projections & Trends |
| Total Inbound Visitors | 25.2 million | ~26.0–26.5 million |
| Direct Traveler Spending | $12.8 billion | ~$13.3–$13.5 billion |
| State & Local Tax Revenue | $955 million | ~$980 million–$1.0 billion |
| Tourism-Supported Employment | 109,300 jobs | ~111,000+ jobs |
| Oklahoma City Metro Spend Share | $2.8 billion (Metro core) | ~$3.0 billion |
Primary Feeder Markets and Travel Motivations
- Who Visits Most: Regional drive corridors supply over 75% of arrivals, heavily led by Texas (particularly the Dallas–Fort Worth metroplex), Kansas, Missouri, and Arkansas. International visitors are led by Germany, the United Kingdom, and Canada, drawn specifically to Western Americana and vintage highway circuits.
- Why They Come:
- Historic Route 66 Exploration: Oklahoma holds over 400 drivable miles of the Mother Road, anchoring major demand for iconic roadside architecture, neon revitalization corridors, and centennial festivals.
- Native American & Western Heritage: First Americans Museum (FAM), the National Cowboy & Western Heritage Museum, and major tribal cultural centers.
- Outdoor Recreation & Lake Corridors: Boating, hiking, and cabin retreats across Beavers Bend / Broken Bow, the Wichita Mountains Wildlife Refuge, and Grand Lake O’ the Cherokees.
Comparative Analysis of Tourism Growth in Nevada, Kansas, Massachusetts and Oklahoma: 2025 vs 2026
The following table compares visitor arrivals, tourism expenditure, economic performance and major growth drivers across four US states, based on the supplied 2025 benchmarks and 2026 projections.
| Tourism Indicator | Nevada | Kansas | Massachusetts | Oklahoma |
|---|---|---|---|---|
| 2025 Visitor Arrivals | 38.5 million (Las Vegas) | 38.4 million | 29.5 million statewide person-trips | 25.2 million |
| 2026 Projected Arrivals | 40.5 million (Las Vegas) | 39.2–39.8 million | 30.8–31.2 million | 26.0–26.5 million |
| Projected Visitor Growth | 5.2% | 2.1–3.6% | 4.4–5.8% | 3.2–5.2% |
| 2025 Economic Benchmark | $15.8 billion gaming revenue | $8.2 billion direct spending | $25.8 billion direct spending | $12.8 billion direct spending |
| 2026 Economic Projection | $16.0 billion gaming revenue | $8.6–8.8 billion direct spending | $27.2–27.5 billion direct spending | $13.3–13.5 billion direct spending |
| Major Tourism Driver | Casino resorts, conventions, Formula 1 | FIFA World Cup spillover, youth sports | FIFA World Cup, international travel | Route 66 Centennial, heritage tourism |
| Leading Domestic Feeder Markets | California, Arizona, Utah, Texas | Missouri, Nebraska, Oklahoma, Texas | New York, Connecticut, Rhode Island | Texas, Kansas, Missouri, Arkansas |
| Leading International Markets | Mexico, Canada, UK | Canada, Mexico, Germany, UK | Canada, UK, China, India | Germany, UK, Canada |
| Tourism Growth Opportunity | Luxury travel and high-value events | Sports tourism and regional accommodation | International tourism and coastal travel | Road trips and cultural tourism |
| 2026 Strategic Outlook | Higher visitor yield | Event-led regional growth | Strong international spending potential | Heritage-led regional expansion |
How Nevada, Kansas, Massachusetts and Oklahoma Are Reshaping US Tourism Growth in 2026
Nevada Ignites Explosive Tourism Showdown as Kansas Massachusetts and Oklahoma Chase Stunning 2026 Gains.The comparative analysis of Nevada, Kansas, Massachusetts and Oklahoma reveals a significant shift in US tourism towards higher visitor spending, event-driven travel and diversified destination experiences. While Nevada continues to capitalise on gaming, conventions and sports entertainment, Kansas is strengthening its position through regional tourism and major sporting events. Massachusetts benefits from international connectivity, heritage attractions and the FIFA World Cup, while Oklahoma is leveraging the Route 66 Centennial to stimulate road-trip tourism and regional economic activity.
The supplied 2026 projections suggest that visitor spending and economic impact are becoming increasingly important measures of tourism performance, alongside arrival numbers. Massachusetts could generate up to $27.5 billion in direct visitor spending, followed by Oklahoma at $13.5 billion and Kansas at $8.8 billion. Nevada’s statewide gaming revenue could approach $16 billion, although this represents a different economic measure and cannot be directly compared with total visitor expenditure.
Looking ahead, the four states demonstrate how major events, transport connectivity, cultural heritage and outdoor recreation can create opportunities for hotels, restaurants, local businesses and tourism operators. However, these projected gains will depend on actual visitor demand, travel costs and spending patterns. The central finding is that US tourism growth in 2026 is increasingly being shaped not simply by how many travellers arrive, but by how much they spend, how long they stay and how widely their economic contribution reaches local communities.
Advertisement
