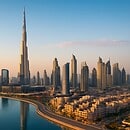
Image generated with Ai
Indonesia tourism arrivals reached a post-pandemic first-half record in 2026, signaling stronger demand across Southeast Asia’s largest economy. Official data show 7.45 million international visits between January and June, 5.71 per cent more than a year earlier and the highest comparable total since 2020. The advance matters because visitor spending supports hotels, restaurants, airlines, transport operators, attractions and local enterprises across the archipelago. Yet June’s annual decline, uneven hotel performance and Bali’s continuing gateway dominance reveal vulnerabilities. Indonesia must now convert rising volumes into longer stays, wider regional dispersal, higher local earnings and tourism growth that protects communities and natural assets.
Indonesia received precisely 7,453,589 international visitor arrivals between January and June 2026, according to figures published by BPS-Statistics Indonesia. That represented growth of 5.71 per cent from 7,051,310 visits during the corresponding period of 2025. More importantly, it was Indonesia’s highest first-half result since 2020, when the COVID-19 crisis disrupted international borders and brought global tourism to an abrupt standstill.
Advertisement
The total provides firm evidence that Indonesia tourism arrivals have continued to recover. It also places the country within reach of its official 2026 objective, although maintaining the same momentum during the second half cannot be assumed. Indonesia’s Ministry of Tourism has set a target of between 16 million and 17.6 million international visitors for the full year. Meeting the lower boundary would require at least 8.55 million additional arrivals between July and December.
That requirement is demanding but not unprecedented. Indonesia generally attracts heavy international traffic during the Northern Hemisphere summer, the Australian winter holiday period and the year-end festive season. However, the monthly figures show that growth is not occurring at a uniform rate.
Advertisement
Advertisement
June produced 1,386,575 international visits. This was 0.32 per cent higher than May but 2.15 per cent below June 2025. The decline interrupted several months of annual expansion and demonstrated why the first-half record should not be interpreted as an automatic guarantee of achieving the annual target.
The headline result therefore contains two related messages. Indonesia’s recovery has reached a new post-pandemic milestone, but short-term demand remains sensitive to holiday calendars, source-market conditions, flight capacity and regional economic pressures. The policy challenge is to preserve momentum while generating more value from each arrival.
The first-half total matters because international tourism connects several parts of the Indonesian economy. An overseas visitor may purchase flights, accommodation, meals, local transport, admission tickets, guided experiences, handicrafts and other services during a single journey. The resulting expenditure can move through supply chains supporting farms, fisheries, retail businesses, creative enterprises and community-based operators.
Tourism’s importance cannot be measured through arrivals alone. bps ‘s Tourism Satellite Account Indonesia 2022–2024, released in March 2026, examines tourism from both demand and supply perspectives. It covers visitor expenditure, tourism-related products, employment, value added and contribution to gross domestic product using a framework aligned with United Nations and UN Tourism standards.
This statistical approach is significant because a rising visitor count does not automatically deliver proportionate gains to the national or local economy. Economic value depends on how long visitors remain, where they travel, which services they buy and how much of their spending reaches Indonesian workers and enterprises.
The first-half record strengthens demand for accommodation, aviation and visitor services. It can improve cash flow for businesses and encourage investment in places where reliable visitor growth is established. It may also support employment in destinations that depend heavily on tourism.
Nevertheless, strong arrival numbers can create pressure when growth is concentrated in a limited number of locations. Congestion, waste management, water demand, land-use change and pressure on cultural or environmental assets can erode the quality of a destination. Indonesia’s policy response must therefore balance tourism growth, community benefits and environmental management.
The first half of 2026 was shaped by generally positive annual growth followed by a modest reversal in June. International visits reached approximately 1.16 million in February, increasing by 13.37 per cent from February 2025. March recorded 1.09 million visits, representing annual growth of 10.50 per cent.
April then produced 1.25 million arrivals, 7.22 per cent above the corresponding month of 2025. May reached 1.38 million, advancing 5.83 per cent annually. By the end of May, the cumulative total had climbed to approximately 6.07 million, leaving June to carry the first-half figure to 7.45 million.
The sequence reveals a gradual moderation in the annual growth rate:
The softer June result does not erase the strength accumulated earlier in the year. It does, however, show why a post-pandemic record must be examined alongside monthly movements. Visitor flows respond to school holidays, religious observances, airline schedules, currency conditions and the timing of major events.
June 2026 still performed strongly in absolute terms. Its 1.39 million visits were only about 30,500 below the 1.42 million recorded in June 2025. The monthly increase from May also meant that overall traffic did not contract sequentially.
Official BPS releases document February’s 1.16 million visits, March’s 1.09 million, April’s 1.25 million and May’s 1.38 million.
Short-haul markets remained fundamental to Indonesia tourism arrivals. Malaysian passport holders represented 18.66 per cent of international visits in June 2026, making Malaysia the largest source market. Singapore followed with 12.25 per cent, while Australia contributed 12.08 per cent.
In numerical terms, Indonesia received approximately 258,690 Malaysian visitors, 169,910 Singaporean visitors and 167,500 Australian visitors during June. Together, these three markets generated nearly 596,100 visits, equivalent to roughly 43 per cent of the national monthly total.
Malaysia’s position reflects geographic proximity, extensive transport connections and strong cultural, commercial and family links. Travellers can enter Indonesia through major airports as well as ferry and border gateways. This gives Malaysia an influence extending beyond Bali and Jakarta to bat am, binman, Sumatra and parts of Kalimantan.
Singapore is particularly important to maritime destinations in the Riau Islands. Its proximity to bat am and binman supports short breaks, business travel, resort stays and repeat visits. The strong monthly increase in Singaporean arrivals during June also helped offset weaker movement from some other markets.
Australia follows a different geographic pattern. Australian demand is heavily connected to Bali, supported by direct air services from several Australian cities. Bali’s climate, accommodation range, beaches, food, wellness products and established tourism services reinforce this relationship.
The market structure creates both resilience and exposure. Regional visitors can travel more frequently and with shorter planning periods, helping Indonesia recover rapidly when connectivity is available. Yet heavy dependence on neighbouring markets can make monthly results sensitive to school holidays, ferry capacity, airline pricing and currency movements.
International access remains highly concentrated. In June 2026, approximately 1.21 million visitors entered through designated main gateways, while about 175,700 arrivals were recorded through border entry points. Air travel accounted for the overwhelming majority of main-gateway traffic.
I Gusti Ngurah Rai International Airport in Bali received 604,962 international visitors during June. Soekarno-Hatta International Airport serving the Jakarta metropolitan area handled approximately 240,681. Together, the two airports processed around 845,600 foreign arrivals, showing how strongly Indonesia’s tourism system still depends on Bali and Jakarta.
Ngurah Rai’s leading position is unsurprising. Bali has the country’s most internationally recognised destination brand and an extensive network of direct regional and long-haul connections. Australian visitors alone accounted for more than 156,000 arrivals through the airport during June.
Soekarno-Hatta serves a broader mixture of leisure, business, government, family and transit-related demand. Jakarta also acts as a transfer point for visitors continuing to other islands through Indonesia’s domestic aviation network.
bat am was another important gateway, with approximately 156,984 international arrivals reported for June. Its performance illustrates the importance of ferry-based tourism and short-distance regional mobility. Singaporean demand provides bat am and the wider Riau Islands with a market structure different from Bali’s air-dependent model.
Concentration delivers commercial advantages. Airlines can sustain higher frequencies, tourism businesses gain access to established customer flows, and destination marketing benefits from global recognition. However, it can also deepen geographic inequality. Regions with limited international air access may struggle to convert Indonesia’s national visibility into local tourism revenue.
Expanding traffic beyond established gateways requires more than adding flights. Secondary destinations need dependable ground transport, accommodation, visitor information, skilled workers, waste services, safety systems and market-ready experiences. Connectivity becomes commercially sustainable when these components develop together.
Hotel performance improved during the first half, although the gains differed sharply between provinces. The national star-hotel room occupancy rate reached 54.28 per cent in June 2026. That was 3.52 percentage points higher than May and 4.30 percentage points above June 2025.
The increase was commercially meaningful. Higher occupancy can strengthen hotel revenue, sustain employment and support demand for cleaning, food supplies, laundry, transport and maintenance services. It can also encourage delayed investment or refurbishment when operators see evidence of continuing demand.
The monthly pattern was uneven. Star-hotel occupancy stood at 44.89 per cent in February and 42.78 per cent in March. It improved to 48.83 per cent in April and 50.76 per cent in May before rising above 54 per cent in June.
Bali recorded the highest provincial star-hotel occupancy during June at 64.87 per cent. Gorontalo followed at 60.68 per cent, while the Special Region of Yogyakarta reached 60.36 per cent. At the opposite end, Papua Pegunungan recorded 20.55 per cent, Maluku 27.82 per cent and Aceh 29.38 per cent.
These differences show that national growth does not reach every destination equally. Some provinces may receive large numbers of domestic travellers without generating comparable demand for star-rated hotels. Others may face limited flight connectivity, seasonal demand or a shortage of organised tourism products.
Bali’s official provincial data provide further evidence of its exceptional position. The island received 553,328 direct foreign visitors in April 2026, rising 17.21 per cent from March. May arrivals increased again to 578,251. Star-hotel occupancy advanced from 57.94 per cent in April to 61.16 per cent in May.
Average expenditure provides one of the clearest measures of tourism’s economic quality. BPS reported average international visitor spending of approximately US$1,285 per trip during the second quarter of 2026. This was about 7.2 per cent higher than the US$1,199 recorded in the second quarter of 2025, although it was below the first-quarter average of roughly US$1,346.
Accommodation absorbed 37.21 per cent of visitor expenditure. Food and beverages accounted for 19.81 per cent, while shopping and souvenirs represented 11.04 per cent. These three categories together received more than two-thirds of average visitor spending.
Other expenditure included entertainment, local tour packages, local transport, vehicle rental and domestic flights. Increased allocations to entertainment, rental vehicles and internal air travel can indicate that some travellers are purchasing a broader range of experiences or travelling beyond a single location.
The composition matters because different types of spending create different local effects. International hotel chains may retain or transfer part of their revenue, while spending at locally owned restaurants, guides, markets, craft businesses and transport providers may circulate more directly within destination communities.
Visitors stayed for an average of approximately 10.30 nights during the second quarter. That was shorter than the 10.83-night average recorded in the first quarter. Higher spending combined with a shorter average stay suggests greater expenditure per day, but it also highlights the potential economic value of encouraging travellers to remain longer.
Indonesia can pursue higher value through several methods: promoting multi-destination itineraries, improving booking access for local enterprises, strengthening cultural and nature-based experiences, developing meetings and events, and connecting gateways with secondary destinations.
The objective should not simply be to maximise prices. Quality tourism requires reliable service, transparent value, environmental protection and authentic benefits for communities. Visitors are more likely to spend and return when destinations remain attractive, accessible, safe and well managed.
Indonesia’s tourism economy is not sustained by international visitors alone. BPS recorded 107.19 million domestic tourist trips in June 2026, an increase of 0.97 per cent from May and 1.98 per cent from June 2025.
Domestic trips reached 630.41 million between January and June, rising 2.71 per cent from 613.78 million in the corresponding period of 2025. BPS identified this as the highest first-half domestic total since at least 2019.
This enormous domestic market gives Indonesia an advantage unavailable to many tourism-dependent economies. When international demand weakens, domestic travellers can support hotels, transport companies, attractions and food businesses. Domestic movement also distributes tourism activity across provinces that receive relatively few foreign visitors.
The characteristics of domestic and international travel differ. Domestic visitors may take shorter trips, visit relatives, travel around religious holidays or choose accommodation outside classified hotels. Their average expenditure may be lower than that of international travellers, but the total number of trips gives the market enormous commercial importance.
Government programmes encouraging holiday travel, shopping and destination discovery can influence domestic mobility. The Ministry of Tourism’s BINA Holiday and Back to School programme was presented as part of a wider effort to stimulate travel and consumption during the school holiday period. The ministry referenced annual ambitions of around 1.176 billion domestic trips alongside its international visitor target.
Domestic tourism also expands the potential benefits of investment in transport and public infrastructure. Roads, water services, public spaces and sanitation created or improved for destinations can serve residents as well as visitors.
However, the extraordinary trip volume requires careful interpretation. A trip is not the same as a unique traveller, and one person may make several trips during the reporting period. Domestic trip data should therefore be used as a measure of movement, not a count of individual Indonesians travelling.
The first-half record is best described as a post-pandemic record, not an all-time record. Indonesia received 16.11 million foreign tourist visits during the full year of 2019, up 1.88 per cent from 15.81 million in 2018. That remains an essential benchmark for assessing recovery.
International arrivals collapsed to 4.02 million in 2020, a decline of 75.03 per cent from 2019. Travel restrictions and border closures then continued to suppress demand before reopening and restored air services allowed a gradual recovery.
The 2026 first-half total of 7.45 million represents approximately 46 per cent of the entire 2019 volume. Indonesia would need another 8.66 million visits during the second half merely to equal the 2019 full-year result.
This remains possible in arithmetic terms but cannot be treated as a forecast. June 2026 was slightly below June 2025 and also remained under June 2019, when monthly arrivals were approximately 1.45 million. The annual target range indicates that the government expects the full-year total to approach or exceed the earlier national benchmark, but actual performance will depend on future arrivals.
Historical comparisons are also affected by statistical methods, entry-point coverage and improved data systems. bps ‘s current framework combines immigration information from main gateways with data used to estimate or record movements through border points. Readers should rely on bps ‘s published methodology when making detailed comparisons.
The central conclusion is nevertheless clear: Indonesia has moved well beyond the emergency phase of the pandemic collapse. Its next challenge is not merely restoring lost volume. It must improve competitiveness, visitor value, geographic distribution and sustainability.
Indonesia’s official target of 16 million to 17.6 million foreign tourist arrivals requires sustained acceleration. After receiving 7.45 million visitors in the first half, the country had completed approximately 46.6 per cent of the minimum target and 42.3 per cent of the upper target.
To reach 16 million, Indonesia needs about 8.55 million second-half visits, averaging roughly 1.43 million per month. Reaching 17.6 million requires about 10.15 million additional arrivals, or an average approaching 1.69 million per month.
Seasonality could support stronger second-half totals. July and August coincide with major travel periods in Australia, Europe and other source markets. The final quarter can benefit from school holidays, conferences and festive travel. Bali’s global recognition gives Indonesia a strong base for capturing this demand.
The June decline nevertheless demands caution. An average required for the upper target would exceed the June 2026 total by around 300,000 visits every month. That would require a substantial and sustained increase rather than ordinary seasonal variation.
Air capacity will be decisive. International routes determine how many visitors can reach Indonesia, from which markets and at what cost. The government has continued discussions with airlines on strengthening established services and exploring connections to destinations beyond Jakarta and Bali. Official tourism diplomacy with Japan, India and ASEAN partners also seeks to support market diversification.
Achieving an arrival target is only one part of tourism policy. A lower number of longer-staying, higher-spending visitors distributed across more provinces could produce stronger local economic returns than a much larger volume concentrated in overcrowded areas.
The most meaningful test will therefore combine four measures: visitor numbers, expenditure, length of stay and destination dispersal. Environmental and community indicators should accompany them.
Indonesia has continued to modernise the administrative experience for international arrivals. The All Indonesia arrival declaration combines information previously collected separately for immigration, customs, health and quarantine purposes.
International passengers can complete the declaration online within three days before arrival. The integrated process is intended to simplify reporting, reduce duplicate forms and support a smoother border experience. Completing the declaration does not replace the requirement to hold the appropriate visa or immigration permission.
The Directorate General of Immigration also operates Indonesia’s official electronic visa platform, including the Electronic Visa on Arrival system. Eligibility, permitted activities, stay duration and extension conditions depend on nationality and visa category. Travellers should use official immigration channels rather than relying on unverified commercial websites.
digitization can support tourism in several ways. Faster processing may reduce queues at major gateways, integrated information can improve border management, and advance submission can help passengers correct or identify documentation issues before arrival.
Technology alone does not eliminate entry risks. Visitors remain responsible for passport validity, visa compliance, permitted activities and departure deadlines. Rules can change, and travellers should check the official immigration website immediately before travel.
For tourism businesses, a smoother arrival process strengthens the first stage of the visitor experience. This becomes increasingly important as Ngurah Rai and Soekarno-Hatta process large international volumes.
Official guidance is available through the Directorate General of Immigration, the official Indonesian eVisa portal and the government’s All Indonesia declaration announcement.
Bali’s performance remains a national strength, but excessive concentration creates risks for both the island and the wider country. When most international demand passes through a small number of gateways, communities elsewhere receive a limited share of tourism revenue despite possessing substantial natural and cultural assets.
Dispersal should not mean copying Bali’s development model across every destination. Lake Toba, Borobudur-Yogyakarta-Prambanan, Lombok, Labuan Bajo, Wakatobi, raga amp at and other regions have distinct environmental limits, community structures and market opportunities.
Successful dispersal requires integrated planning. Visitors need convenient transport, trustworthy accommodation, trained guides, clear booking channels, functioning sanitation, waste management and experiences worth extending a journey to include.
The Indonesia Tourism Development Project provides evidence of what coordinated investment can achieve. By the end of 2024, work across six destinations had improved water access for approximately 570,000 people, created 542,000 square metres of non-motorized public space and improved sanitation for 470,000 people.
More than 20,000 businesses expanded their online presence, over 84,000 tourism professionals received certification, and 18,000 participants from 155 tourism villages completed training. The project mobilised more than US$870 million in private investment.
These outcomes matter because destination development should improve local living conditions alongside the visitor experience. Roads, water systems, sanitation and public areas should serve residents rather than creating isolated tourism enclaves.
The World Bank’s official project assessment reports that the programme supported more and better employment opportunities for approximately 1.2 million people across six destinations.
The first-half record creates immediate opportunities across hospitality, transport, food services, retail and the creative economy. Hotels can increase occupancy, restaurants gain additional customers, airlines and ferries carry more passengers, and attractions receive more admissions.
Local enterprises can benefit when visitors purchase crafts, culinary products, guided tours, vehicle hire and cultural experiences. The expenditure structure shows that food, shopping and entertainment already capture a meaningful share of each international trip.
Tourism can also encourage investment. Consistent demand supports business cases for accommodation, destination services, digital platforms and transport links. Infrastructure improvements can produce wider benefits for residents and other sectors.
Employment is particularly important. Tourism involves a mixture of entry-level, skilled, professional and entrepreneurial work. It can generate opportunities for women, young people, rural communities and creative workers, although job quality, training and predictable income remain crucial.
There are also leakages and distributional risks. Imported goods, overseas booking commissions and externally owned businesses can reduce the share retained locally. Rising property values or commercial rents can disadvantage residents and smaller enterprises. Informal workers may remain excluded from training, finance and social protection.
Government policy can improve the local share by supporting certification, digital access, community enterprises, local supply chains and transparent investment standards. Reliable visitor data should guide infrastructure and training decisions rather than promotional ambition alone.
The most productive interpretation of the 7.45 million figure is therefore not simply that more foreigners entered Indonesia. It is that Indonesia gained millions of opportunities to connect visitor spending with local products, employment and regional development.
Several challenges remain visible despite the record. The first is slower short-term growth. June’s 2.15 per cent annual decline shows that international demand can soften even while cumulative figures remain positive.
The second is source-market concentration. Malaysia, Singapore and Australia supplied about 43 per cent of June arrivals. Strong demand from these countries is valuable, but sudden changes in airfares, currencies, holidays or consumer confidence could have an outsizes effect.
The third is gateway concentration. Bali and Jakarta dominate international air entry, while bat am depends heavily on nearby regional travel. Other destinations need stronger connectivity and market readiness before they can absorb a larger share.
The fourth is uneven accommodation performance. National occupancy exceeded 54 per cent in June, but several provinces remained below 30 per cent. Building additional rooms without sufficient demand could create underused capacity and financial pressure.
Environmental constraints form a fifth challenge. Tourism expansion increases demand for water, energy, roads and waste services. In fragile island, marine and mountain environments, unmanaged growth may damage the very assets that attract visitors.
The final challenge is ensuring that headline growth becomes measurable community benefit. Arrival totals do not show whether wages are improving, small businesses are participating or tourism earnings remain in the destination.
These weaknesses do not invalidate the record. They explain what government, destination authorities and businesses must address if the recovery is to become durable.
Travellers can expect Indonesia to remain highly active during the second half of 2026, especially in Bali, Jakarta and regional gateways connected to Malaysia, Singapore and Australia. Advance booking may be sensible during major holiday periods, but visitors should compare official entry requirements, transport schedules and local conditions before departure.
Businesses should avoid assuming that every destination will experience the national growth rate. Market conditions vary by province, gateway, season and traveller segment. BPS data should be monitored monthly to distinguish sustained demand from temporary spikes.
Hotels and operators can respond to the spending evidence by developing packages combining accommodation with food, cultural experiences, local transport and visits to secondary destinations. Such packages may increase expenditure while making travel planning easier.
Destination managers should monitor occupancy, water use, waste volumes, traffic and resident sentiment. These measures can identify pressure before congestion or environmental decline damages the visitor experience.
Airlines and transport providers will remain central to whether Indonesia reaches its annual target. Additional capacity is most valuable when coordinated with destination marketing and reliable local infrastructure.
For travellers, the record means greater competition for popular places but also a growing selection of tourism products. For businesses, it signals opportunity accompanied by the need for evidence-based planning.
The official data support a cautiously positive outlook. First-half arrivals grew by 5.71 per cent, domestic trips increased by 2.71 per cent, visitor spending rose annually in the second quarter, and national hotel occupancy strengthened in June.
These indicators show that tourism demand is supporting multiple parts of the economy. They also demonstrate that Indonesia’s recovery has moved into a more mature phase. Policy must now focus on quality, resilience and distribution rather than recovery alone.
The lower end of the official international target remains achievable if average monthly arrivals strengthen during the peak second half. The upper target requires substantially faster performance and should be treated as an ambition, not a certainty.
Long-term competitiveness will depend on efficient gateways, sustainable infrastructure, service quality, skills and the protection of cultural and natural assets. Market diversification can reduce dependence on a few countries, while better domestic connections can distribute visitors more widely.
Indonesia has already demonstrated that coordinated infrastructure and training can benefit residents, businesses and visitors. Extending that approach will be essential as arrivals approach or exceed pre-pandemic levels.
The first-half record is therefore a milestone rather than a destination. Its lasting value will be determined by what Indonesia does with the demand it has recovered.
Indonesia’s first-half record confirms that international tourism has regained powerful momentum, with 7.45 million visits, rising expenditure and improving hotel occupancy supporting businesses nationwide. However, Indonesia tourism arrivals remain concentrated in several source markets, gateways and destinations, while June’s annual decline demonstrates that growth cannot be assumed. Reaching the 2026 target will require sustained air access, efficient entry systems, competitive visitor experiences and stronger connections beyond Bali and Jakarta. The larger priority is converting volume into durable value. Longer stays, locally retained spending, skilled employment, infrastructure, environmental safeguards and community participation will determine whether this recovery produces resilient and widely shared prosperity.
[Source:- VN Express International]
Advertisement
Advertisement
Advertisement












Wednesday, September 2, 2026

Tuesday, September 1, 2026

Wednesday, September 2, 2026

Wednesday, September 2, 2026

Tuesday, September 1, 2026
Tuesday, September 1, 2026

Wednesday, September 2, 2026

Wednesday, September 2, 2026