
Malta Exposes the Gap Between Tourism Growth and Spending Per Visitor

Updated
Published
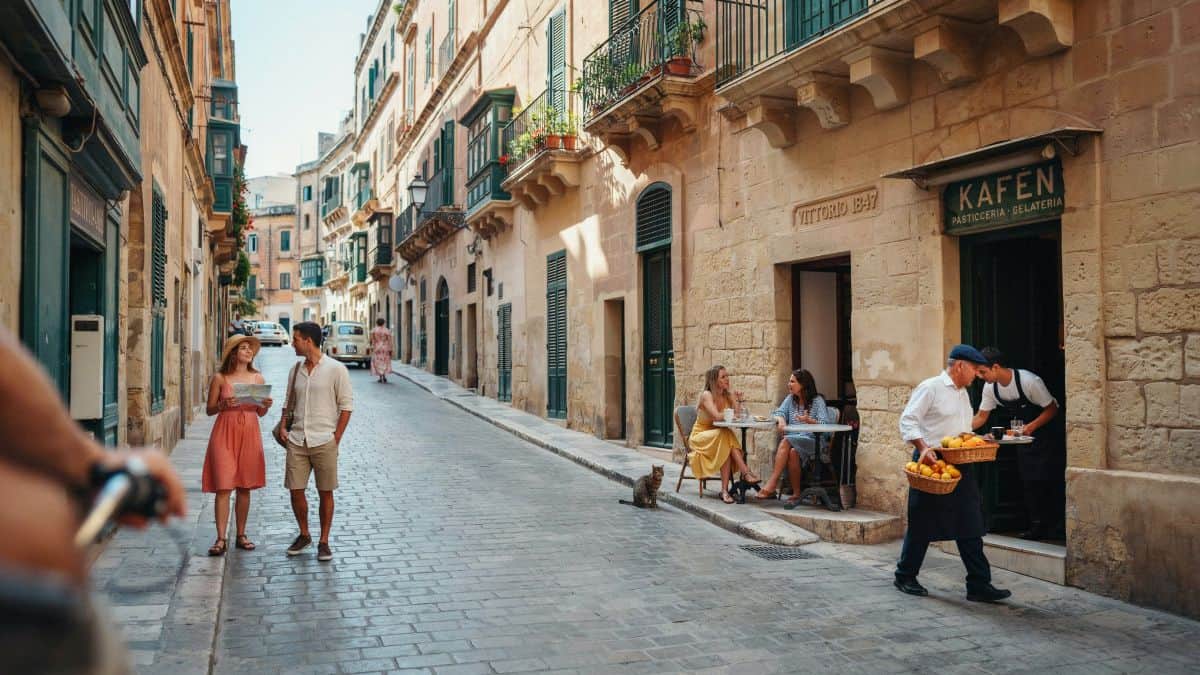
Malta illustrates the difference between tourism expansion and spending per tourist through an amazing series of figures in 2026. The number of tourists was up by 17.9%, while tourism expenditures increased by 15.6%. At the same time, average expenditures per tourist decreased from €956 to €937. This is important as an increase in the number of tourists does not necessarily mean an increase in the value of each individual visit. At the same time, the number of overnight visitors rose slower than the number of tourists. These figures explain the importance of looking at other metrics aside from the numbers of people.
Europe’s Tourism Growth Is Strong, but Not Even
International tourist arrivals across Europe rose by 3% in the first half of 2026, according to UN Tourism. The European Union recorded 1.321 billion overnight stays in tourist accommodation during the same six-month period, up 1.7% from the first half of 2025. It was the highest total Eurostat had recorded for the first two quarters of a year. These figures point to continued demand, though they measure different things: arrivals count visitors, while overnight stays count the nights they spend in accommodation.
Advertisement
Advertisement
Growth also varied across destinations. In the second quarter, overnight stays rose by 9.8% in Lithuania, 9.0% in Malta and 5.0% in Poland. The EU increase was 1.2% for that quarter. Across the first half of the year, 18 of the 27 EU countries recorded more overnight stays than in the same period in 2025. Cyprus saw the largest fall, at 7.7%.
These differences show why a single headline number can hide local changes. A smaller country can post a faster percentage increase, while a larger destination can add more nights in absolute terms. In the first half of 2026, Italy, Spain and France recorded the biggest increases in total overnight stays. Spain’s domestic visitors helped drive its rise, while international tourism contributed more to growth in Italy and France.
Advertisement
Advertisement
For travellers, these results do not promise empty beaches or lower prices in places with faster growth. They show where demand increased, not how busy every town or attraction became. Still, they suggest that Europe’s travel story is broader than its most famous capitals and resorts.
Spain’s Visitor Numbers Rose, but Trip Spending Barely Changed
Spain received approximately 70.4 million international tourists between January and August 2026, an increase of 5.4% on the same period in 2025. In August alone, it welcomed 12.3 million, up 9.2% year on year. The United Kingdom remained its largest source market for that month, with more than 2.4 million visitors. Arrivals from the United States also increased, rising 31.9% in August.
Advertisement
Advertisement
Spending rose too. International tourists spent €99.892 billion in Spain during the first eight months of 2026, an 8.0% increase. August expenditure reached €17.838 billion, up 9.2% from August 2025. At first glance, the arrival and spending figures look like a clear double gain. But the detail offers a more careful picture.
The average tourist spent €1,455 in August, broadly unchanged from a year earlier. Average daily spending rose 1.9% to €202, while the average trip lasted around 7.2 days, a 1.9% decline. So visitors spent slightly more per day, but they stayed for slightly less time on average. Total spending increased alongside the larger visitor count.
Advertisement
Advertisement
This is a useful distinction for an article about tourism’s economic effect. Higher total receipts do not necessarily mean that each traveller spent much more. Nor do these figures tell us how much businesses kept after their costs. They do show why arrivals and spending should be examined together. A record crowd may bring a large total, while each individual trip follows a different pattern.
Spain also illustrates how source markets can shape the result. Visitors from the United Kingdom accounted for 18.9% of August expenditure, followed by France at 12.6% and Germany at 11.1%. These figures can help explain who contributed to the total, although they do not show how spending was shared among regions or businesses.
Greece Earned More in July as Arrivals Fell
Greece provides one of the sharpest contrasts in Europe’s 2026 tourism figures. In July, inbound traveller flows fell 3.1% compared with July 2025. Yet travel receipts increased 7.2%, reaching approximately €4.722 billion.
The Bank of Greece said average expenditure per trip rose 10.0% in that month. This helped lift receipts even though fewer travellers arrived. The result does not mean that every visitor spent more, or that tourism grew in every measure. It shows that a fall in arrivals can happen alongside a rise in income from travel.
Advertisement
Advertisement
The monthly decline also needs context. From January to July, Greece’s inbound traveller flows increased 8.6% compared with the same period in 2025. July was therefore a weaker month for arrivals within a stronger seven-month total. Travel receipts for January to July rose 12.0%.
The source markets shifted too. July receipts from residents of EU countries increased just 0.8%, while receipts from residents of other countries rose 15.5%. Within the reported markets, receipts from the United Kingdom increased 49.5%, and receipts from Italy rose 32.3%. These are receipt figures, not visitor counts, so they should not be described as equivalent changes in arrivals from those countries.
For the article, Greece offers a clear way to explain why visitor totals alone can mislead. It also cautions against saying that “more tourists always means more tourism income”. The evidence shows a different relationship in July, but it cannot identify every reason behind it. Spending patterns, visitor mix and trip choices may all matter. The available figures measure the outcome; they do not prove that one campaign or policy caused it.
Malta’s Fast Visitor Growth Came With Lower Average Spending
Malta’s first eight months of 2026 brought a large rise in visitor numbers. The island welcomed approximately 3.16 million inbound tourists, up 17.9% from the same period in 2025. Total tourist expenditure reached €2.963 billion, a rise of 15.6%. However, average expenditure per visitor fell from €956 to €937. Overnight stays increased 10.9%, slower than arrivals.
This combination points to an important difference between growth in total activity and growth in value per visitor. More people came, and total spending rose. But the average amount spent by each inbound tourist was lower. These figures do not prove that Malta’s tourism offer became less valuable. They do show that the number of visitors alone cannot answer whether each visit generated more spending.
The August results make the pattern easier to see. Malta recorded 539,655 inbound tourists, up 14.7% on the year before. Their total expenditure increased 14.9% to €629.3 million. The average length of stay in August was seven nights.
Advertisement
Advertisement
There is also a new local-pressure angle. Published on 15 October 2026, Malta’s tourism-intensity report covers 2025. It estimates that tourism added an average 50,767 people to the country’s resident population across the year. In August, the peak month, the estimated effective population rose by 90,332. The report calculates that San Ġiljan had approximately 143 tourists present for every 100 residents during August. This is a measure of tourism intensity, not a direct measure of residents’ views or pressure on any particular service.
The report’s release date makes it a timely source for the article, but its reference year must remain clear. It describes 2025, while the visitor and spending results above cover 2026. Keeping those dates visible will help readers understand what the figures can, and cannot, say about the current season.
Portugal Shows Why Regional Results Matter
Portugal adds another useful layer to the European picture. In August 2026, tourist accommodation recorded 3.9 million guests and 10.9 million overnight stays. The national total for overnight stays rose 1.7%. Within the country, the increase reached 4.5% in Norte and 2.6% in Alentejo.
Source markets also differed. Overnight stays by visitors from Canada increased 11.2% in August. The United States rose 5.8%, and Spain increased 5.0%. These figures suggest that a national total can conceal important shifts by region and market.
For a traveller, regional growth may make these places interesting to research. But the numbers do not establish that Norte or Alentejo will be cheaper, quieter or easier to book. They do not show a permanent move away from Portugal’s established destinations. They simply provide a starting point for a more local story about where tourism activity is changing.
Europe’s Visitors Are Travelling Close to Home
European tourism is not driven only by long-haul visitors. In 2025, EU residents took approximately 1.20 billion personal and professional trips. Around 70% were domestic trips, while 22% were trips to another EU country. Together, 92% of trips stayed within the EU.
Advertisement
Advertisement
Domestic journeys made up the largest number of trips, but foreign travel accounted for more spending. EU residents spent €266.2 billion on domestic trips and €379.4 billion on foreign trips in 2025. That foreign-trip total includes journeys both within and outside the EU, so it should not be presented as spending solely on travel between EU countries.
These figures provide useful context for the 2026 arrivals story. They show that home markets and cross-border travel both matter. They also show why the number of journeys and their total economic value may tell different stories. The figures cover 2025, however, and should not be described as a measure of European travel during 2026.
Short-Term Rentals Add Another Measure of Demand
Short-term rentals booked through major online platforms recorded 258.8 million guest nights in the EU between April and June 2026. This was 5.3% more than in the same quarter of 2025 and 23.9% above the second quarter of 2024. In the first quarter, the Canary Islands and France’s Rhône-Alpes region each recorded 8.8 million platform-booked nights. Andalucía followed with 8.3 million.
This offers a further view of accommodation demand, especially outside the traditional hotel count. It may help readers understand the range of places receiving stays and the role of short-term rentals in the wider travel market. However, the platform figures should not be added to the EU’s total accommodation-night figures. They come from a separate series and may overlap with other accommodation data.
Nor do they prove that short-term rentals have reduced long-term housing supply in a particular place. That question needs local evidence. The figures show platform-booked stays, not their full effect on communities.
Why Europe’s Tourism Figures Matter
Tourism is a major part of the EU economy. In May 2026, the Council of the European Union cited figures that put the sector’s contribution at 7% of EU gross value added, with 10% of jobs and 4.6 million businesses supported. The Council also called for a more balanced approach to tourism, addressing both pressure in popular destinations and the lack of activity in lesser-known areas. It highlighted regional links, local involvement, skills and better tourism data.
Advertisement
Advertisement
These priorities fit the evidence from across Europe. The EU recorded a high number of overnight stays, but growth varied by country. Greece’s receipts rose in a month when its arrivals fell. Spain’s total spending climbed while the average August tourist spent about the same as a year earlier. Malta attracted many more visitors, yet average spending per visitor fell.
The figures do not show whether local residents feel the benefits, whether businesses are more profitable or how tourism affects housing and public services. Those are important questions for follow-up reporting. The available data point to them; they do not settle them.
What Travellers Should Know
Travellers can use these results to understand where demand is growing, but they should not treat national growth rates as a guide to prices or crowd levels. A rise in overnight stays in one region does not guarantee more hotel rooms or lower costs. A rise in average tourist spending does not mean an individual visitor will face the same bill.
For a practical trip plan, compare current prices for the exact dates and places you want to visit. Check transport options, accommodation and local visitor information before booking. If you are considering a less familiar region, look at its own official tourism and transport updates.
The statistics are best read as signs of change. They show how arrivals, nights and spending moved over particular periods. They cannot predict what every traveller will experience next.
Europe’s Tourism Boom Is More Than a Headcount
Europe in 2026 demonstrates an expenditure gap because Spain, Greece, and Malta report different experiences concerning tourism growth. The desire for travel is high, but each country gets a distinct outcome. There were more tourists to Spain, but their expenditure did not change much. Greece recorded higher earnings in July even though there were fewer tourist arrivals. Malta had more visitors but lower expenditure per capita. On the other hand, the regional data from Portugal illustrates the reason why national data may disguise trends at the local level.
Advertisement
